Introduction
Lee County is situated to the east of Austin. The county seat is Giddings. In 2022, the population of Lee County was 17,954.
Demographic Profile
While the population of Lee County has not grown significantly in the past decade, it has increased slightly nine years out of the past ten. Most of that growth is attributable to domestic migration. From 2012-2020, there were more births than deaths in Lee County. However, in 2021 and 2022 the population experienced more deaths than births.
Figure 1: Population Growth, 2012-2022, Lee County
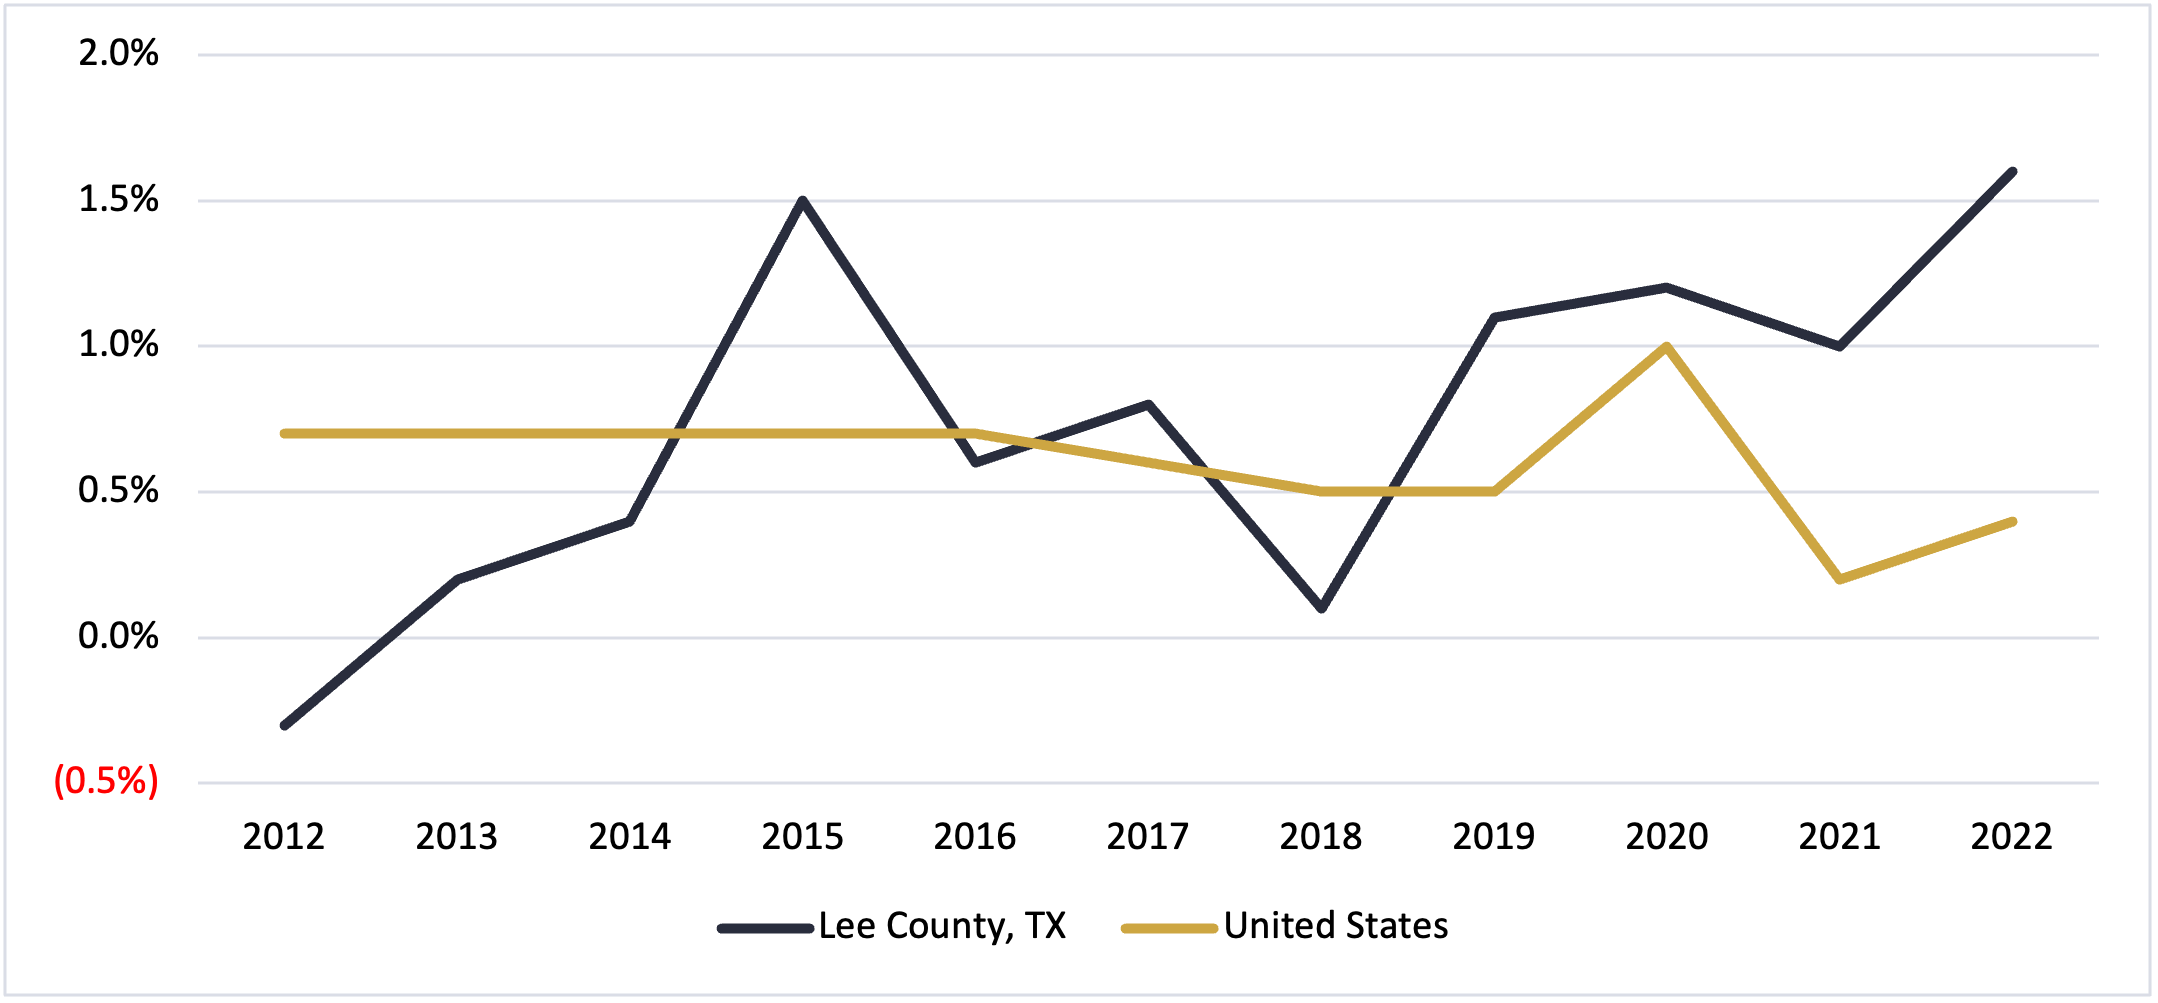
Source: American Community Survey, 2022, 5-Year Estimate Lee County
Figure 2: Population Change Components, 2012-2022, Lee County
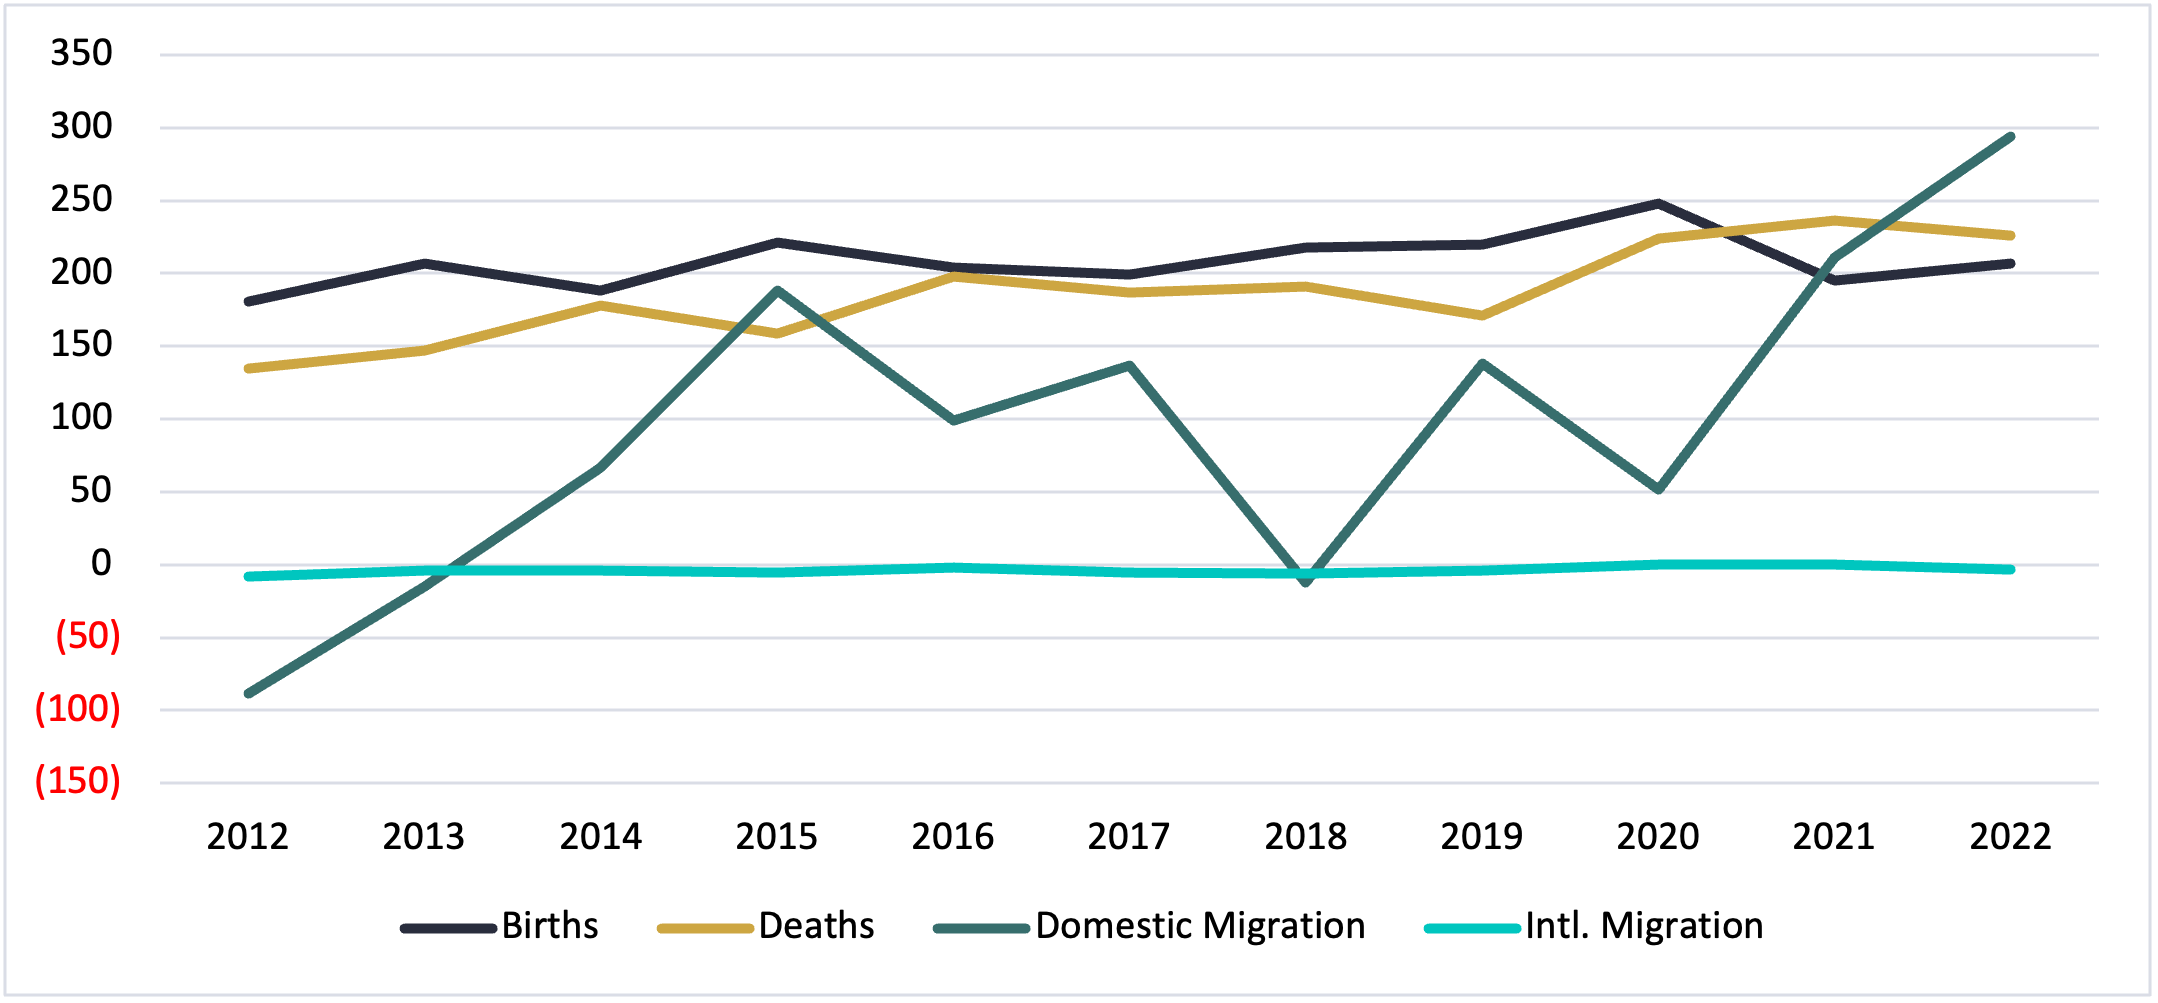
Source: American Community Survey, 2022, 5-Year Estimate Lee County
Employment Trends
The unemployment rate in Lee County in 2022 was 2.8%. This is significantly lower than the state and national unemployment rate (5.2% and 5.3%, respectively). Conversely, the rate of participation in the labor force is lower; 41.7% of the adult population in Lee County is not in the labor force. In the US, 36.5% of adults are not in the labor force, and 34.9% in Texas. So while a lower percentage of Lee County adults are in the lower force, a higher rate of those that are in the labor force are employed.
Table 1: Employment Status of Lee County
|
Subject |
Estimate |
Percent |
|
Population 16 years and over |
14,207 |
--- |
|
In labor force |
8,288 |
58.3% |
|
Civilian Labor Force |
8,288 |
58.3% |
|
Employed |
8,058 |
56.7% |
|
Unemployed |
230 |
1.6% |
|
Not in labor force |
5,919 |
41.7% |
|
Unemployment rate |
--- |
2.8% |
Source: American Community Survey, 2022, 5-Year Estimate Lee County
Educational Attainment
In Lee County, 86.5% of the population (over 25 years-old) holds at least a high school degree, and 16.6% of the population has a bachelor’s degree or higher. Both statistics are lower than state and national averages. The rate of those who have at least a four-year degree is particularly low. In Texas, 88.4% have at least a high school diploma and 33.4% have at least a four-year degree. While in the United States as a whole, those figures are 89.1% and 34.3% respectively.
Figure 3: Educational Attainment in Lee County
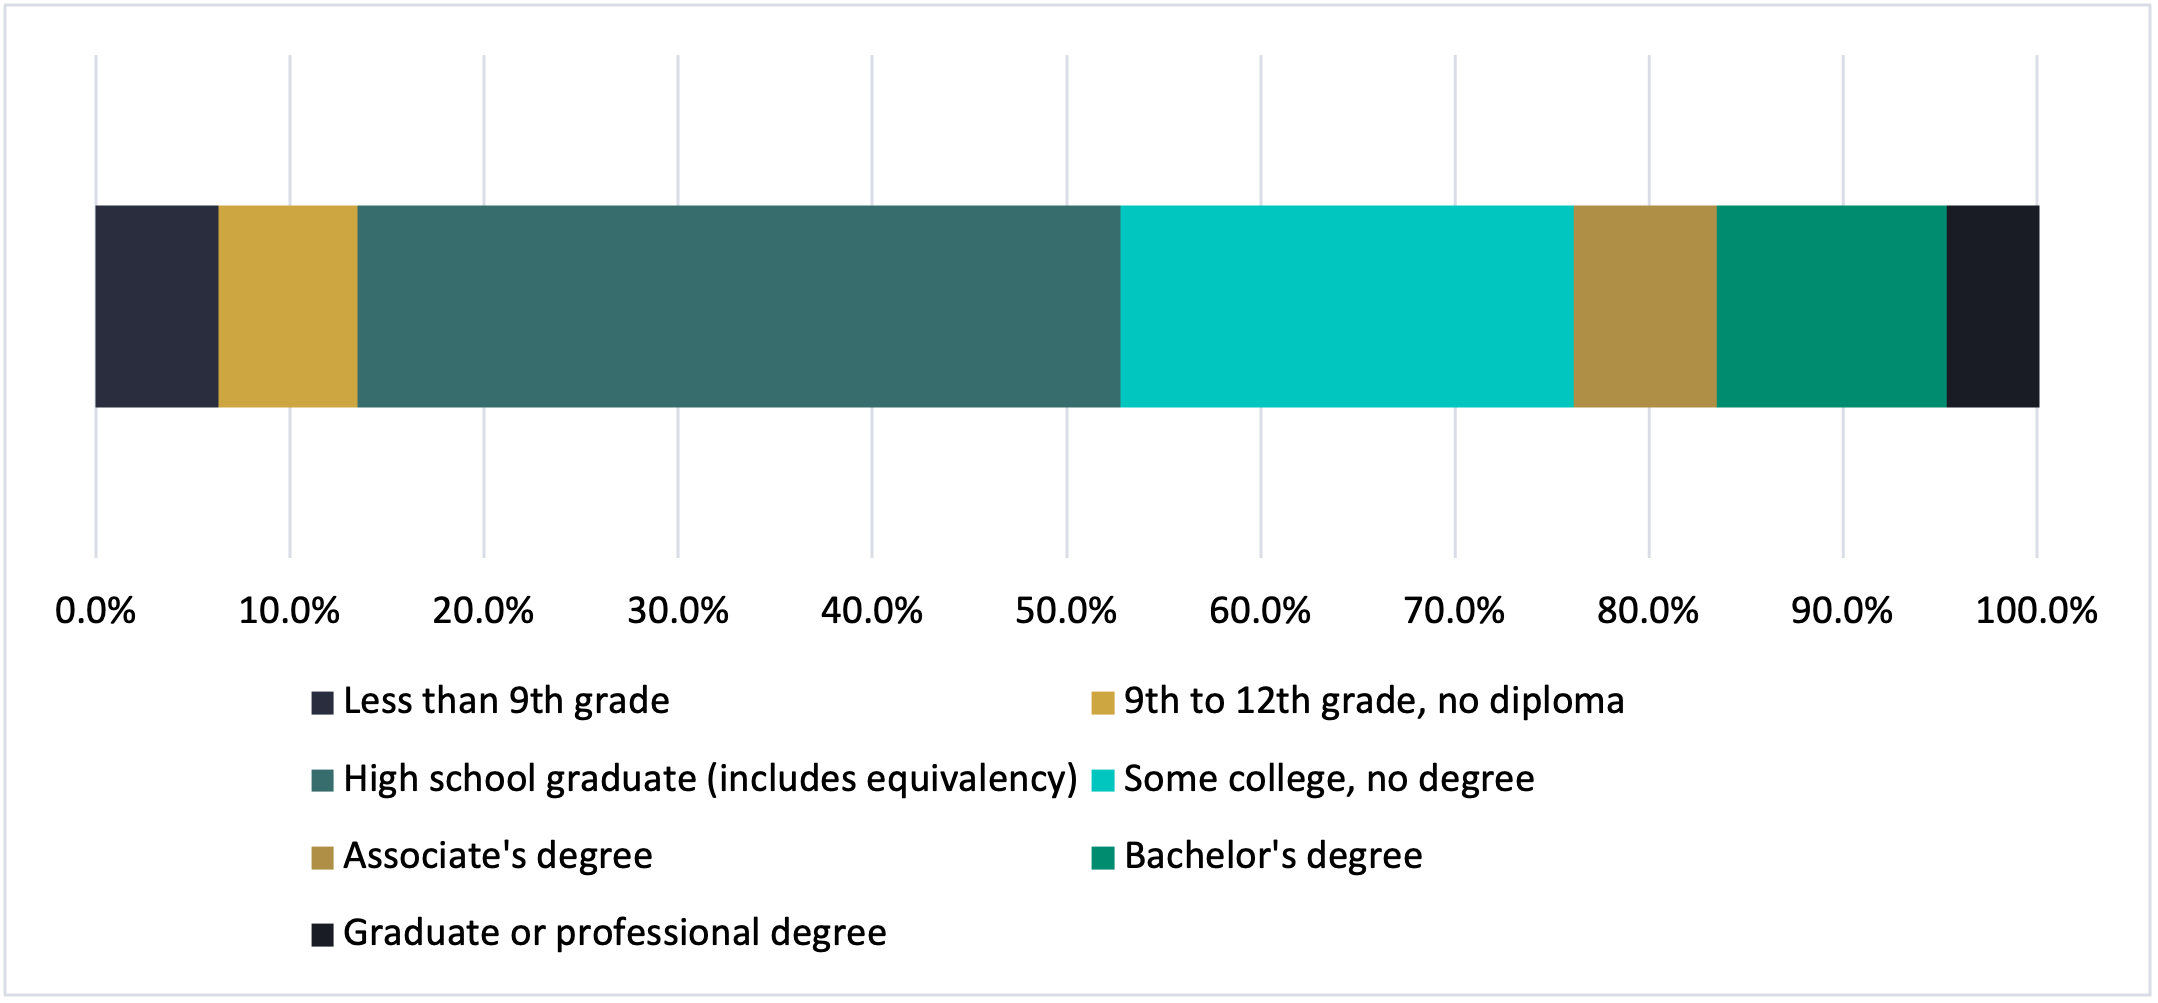
Source: American Community Survey, 2022, 5-Year Estimate Lee County
Wage Trends
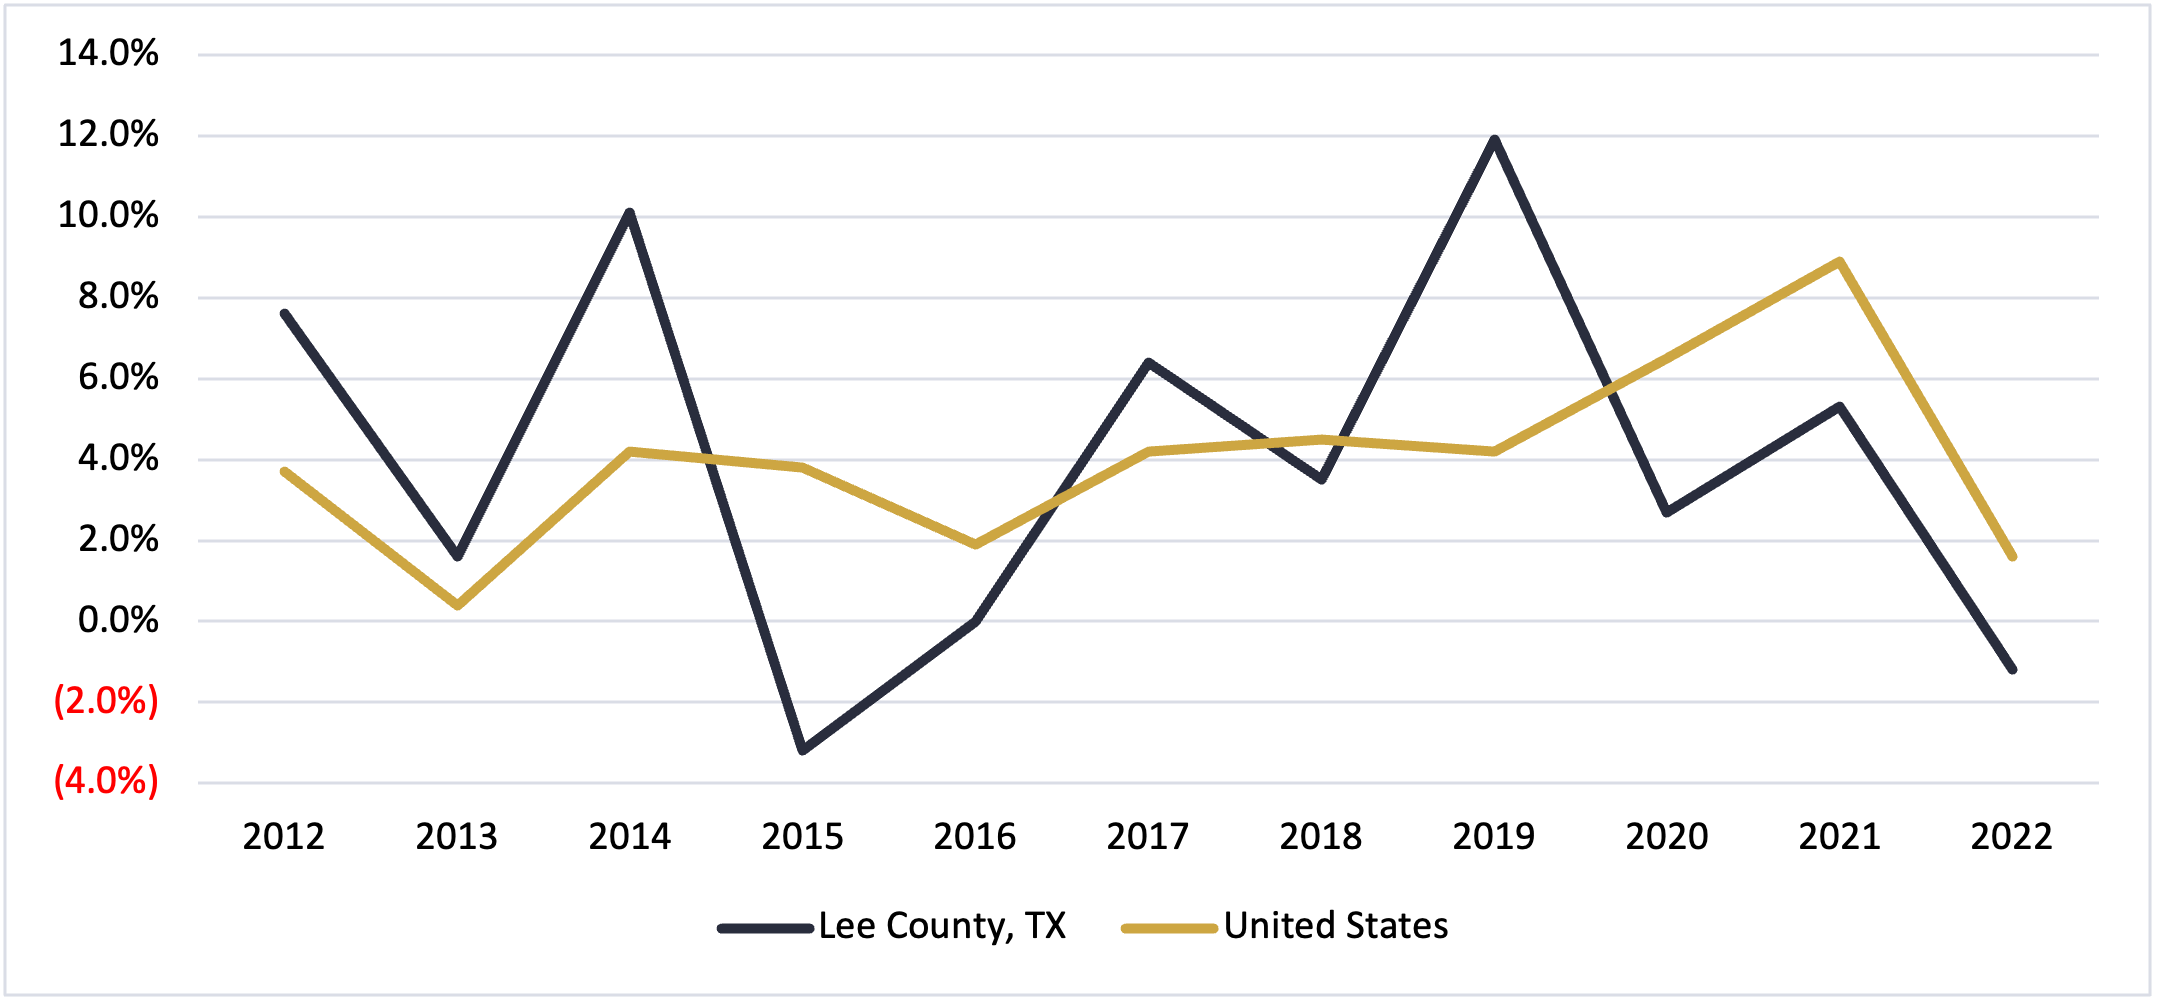
Median Household Income (MHI) growth in Lee County has been at or below US rates of growth for most of the past decade. However, 2012 and 2022 bookend the decade with much higher rates of growth. Most of the steep increases in the MHI growth are proceeded by years of MHI decline.
Figure 4: Median Household Income Growth, 2012-2022, Lee County vs. US
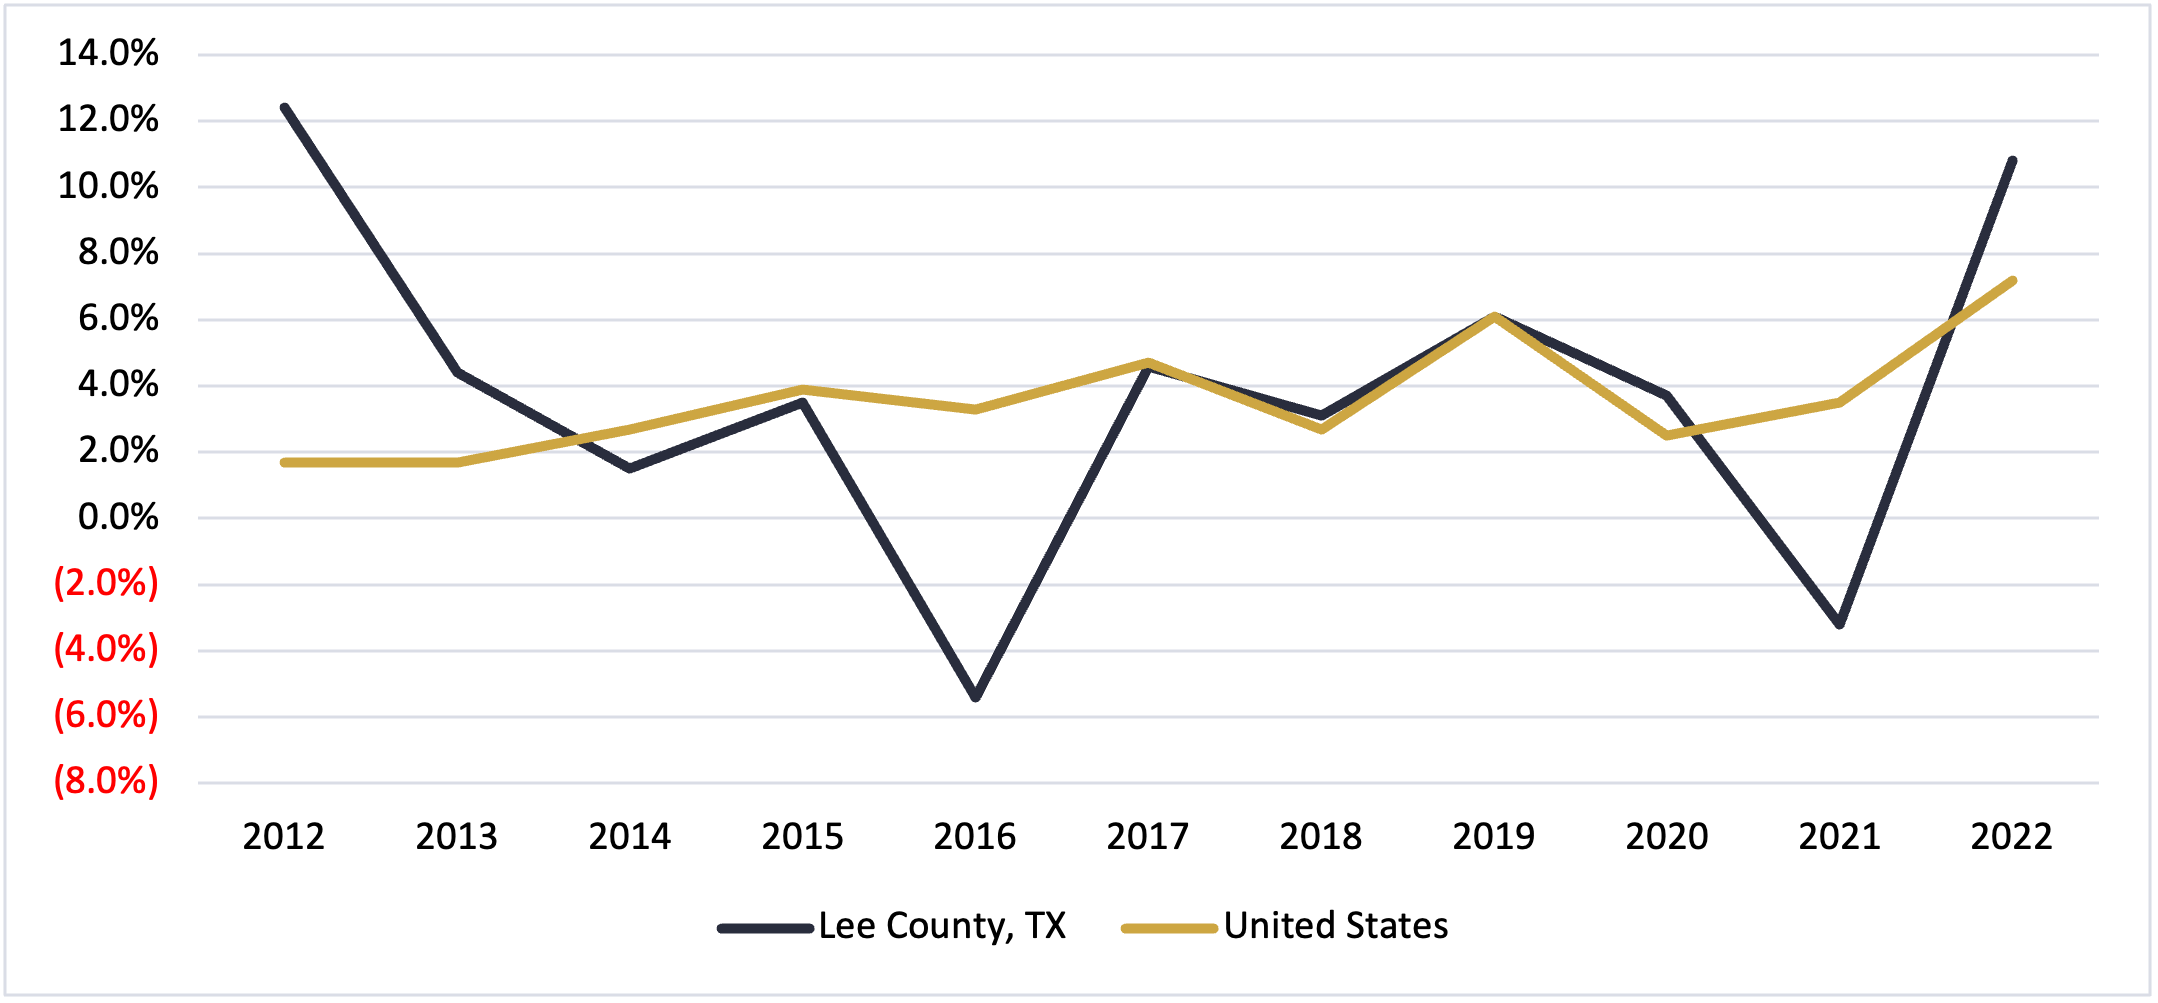
Source: Census Small Area Income and Poverty Estimates (SAIPE)
Per capita income grew eight years out of the past decade in Lee County. Both 2015 and 2022 saw a decline in per capita income.
Figure 5: Per Capita Income Growth, 2012-2022, Lee County vs. US
Source: BEA Regional Economic Accounts
Industry and Occupation Snapshots
Lee County shows a mix of production and services occupations. Construction, Back Office, and Hospitality rank the highest in Lee County’s occupation clusters.
Figure 6: Occupation Cluster Employment, 2022, Lee County
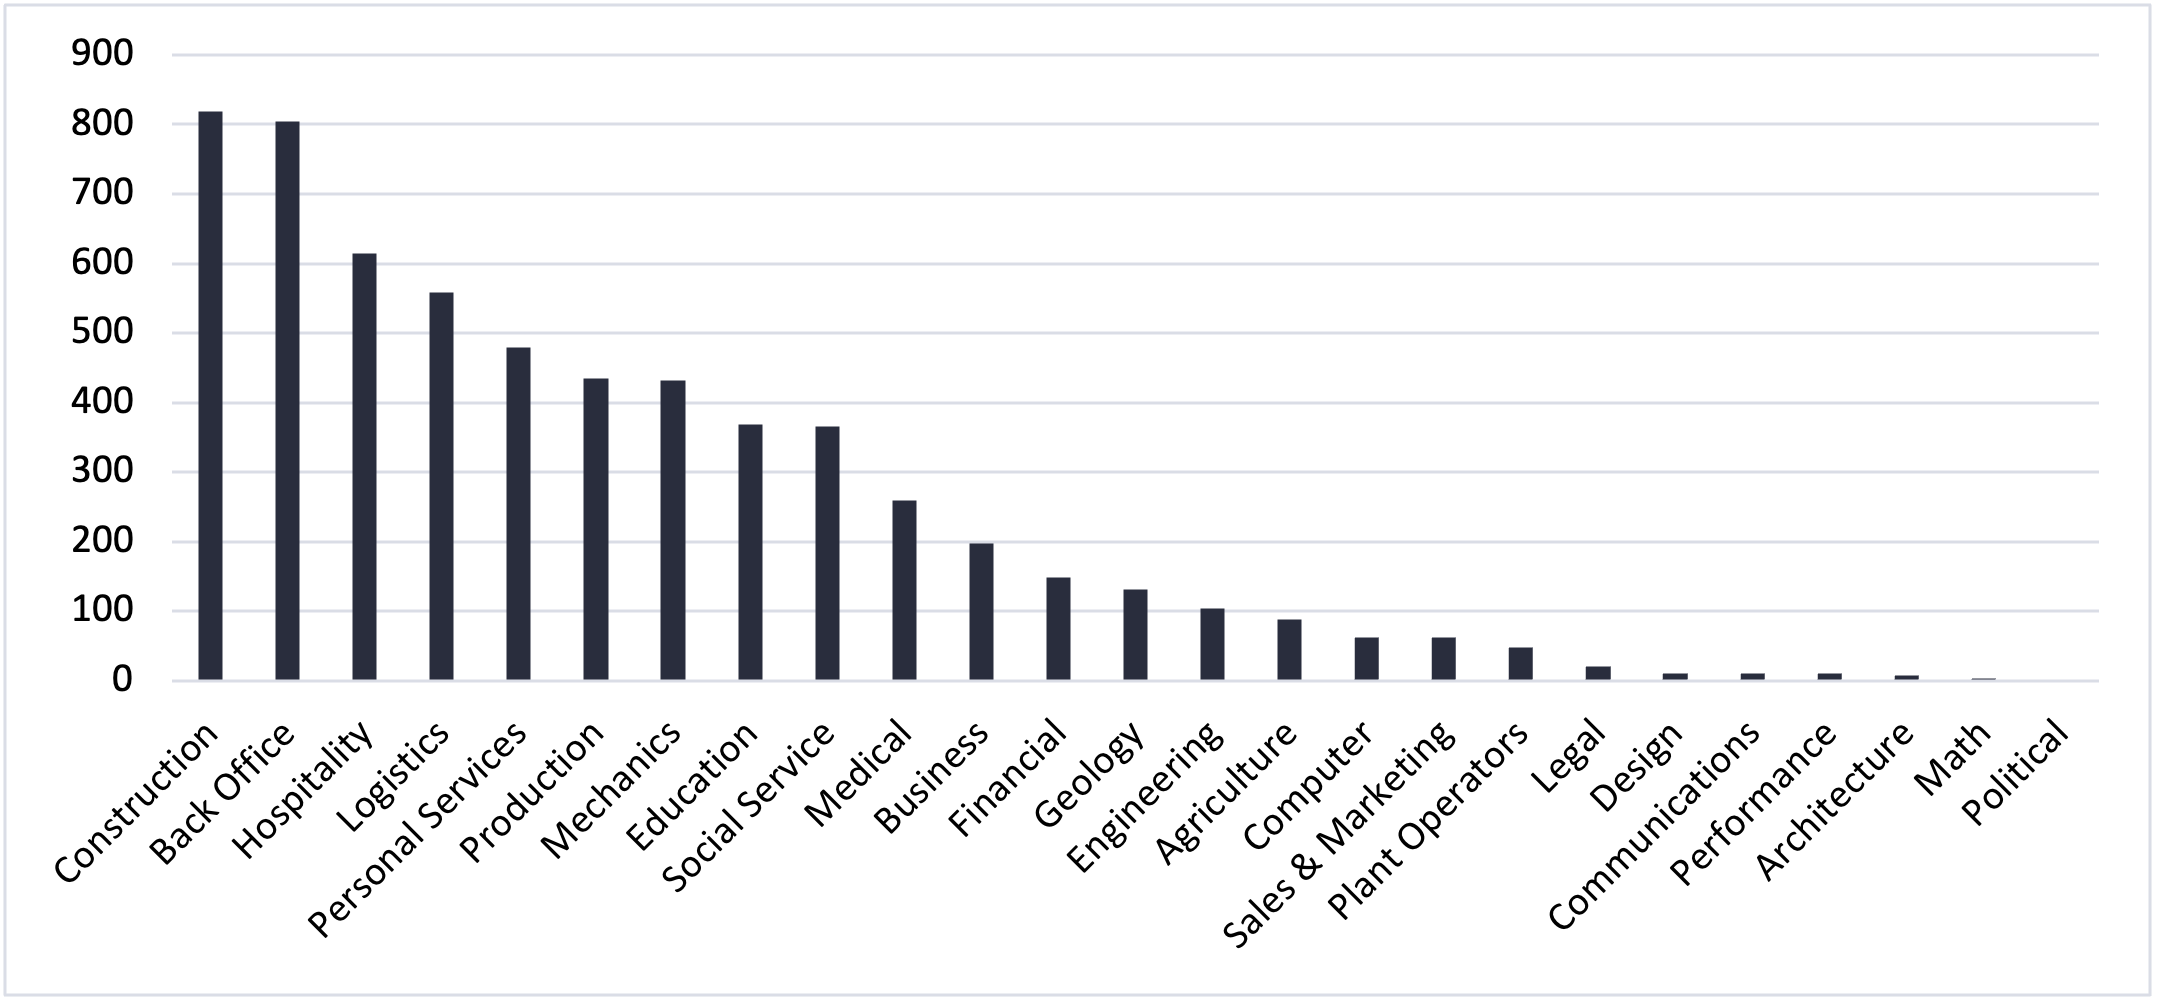
Source: Headlight Data cluster calculations using data from DTG
Gross Regional Product
Lee County’s growth in Gross Regional Product (GRP) has been unstable over the past decade. In the past ten years, four have seen a decline in gross regional product. Some of those years saw a quite significant decline, such as 2015 (9.9%), 2016 (8.8.%), and 2020 (12.5%). In contrast, the US only saw a decline in GRP in one year in the same time period, 2020 (0.9%).
Figure 7: Growth in Gross Regional Product, 2012-2022, Lee County vs. US
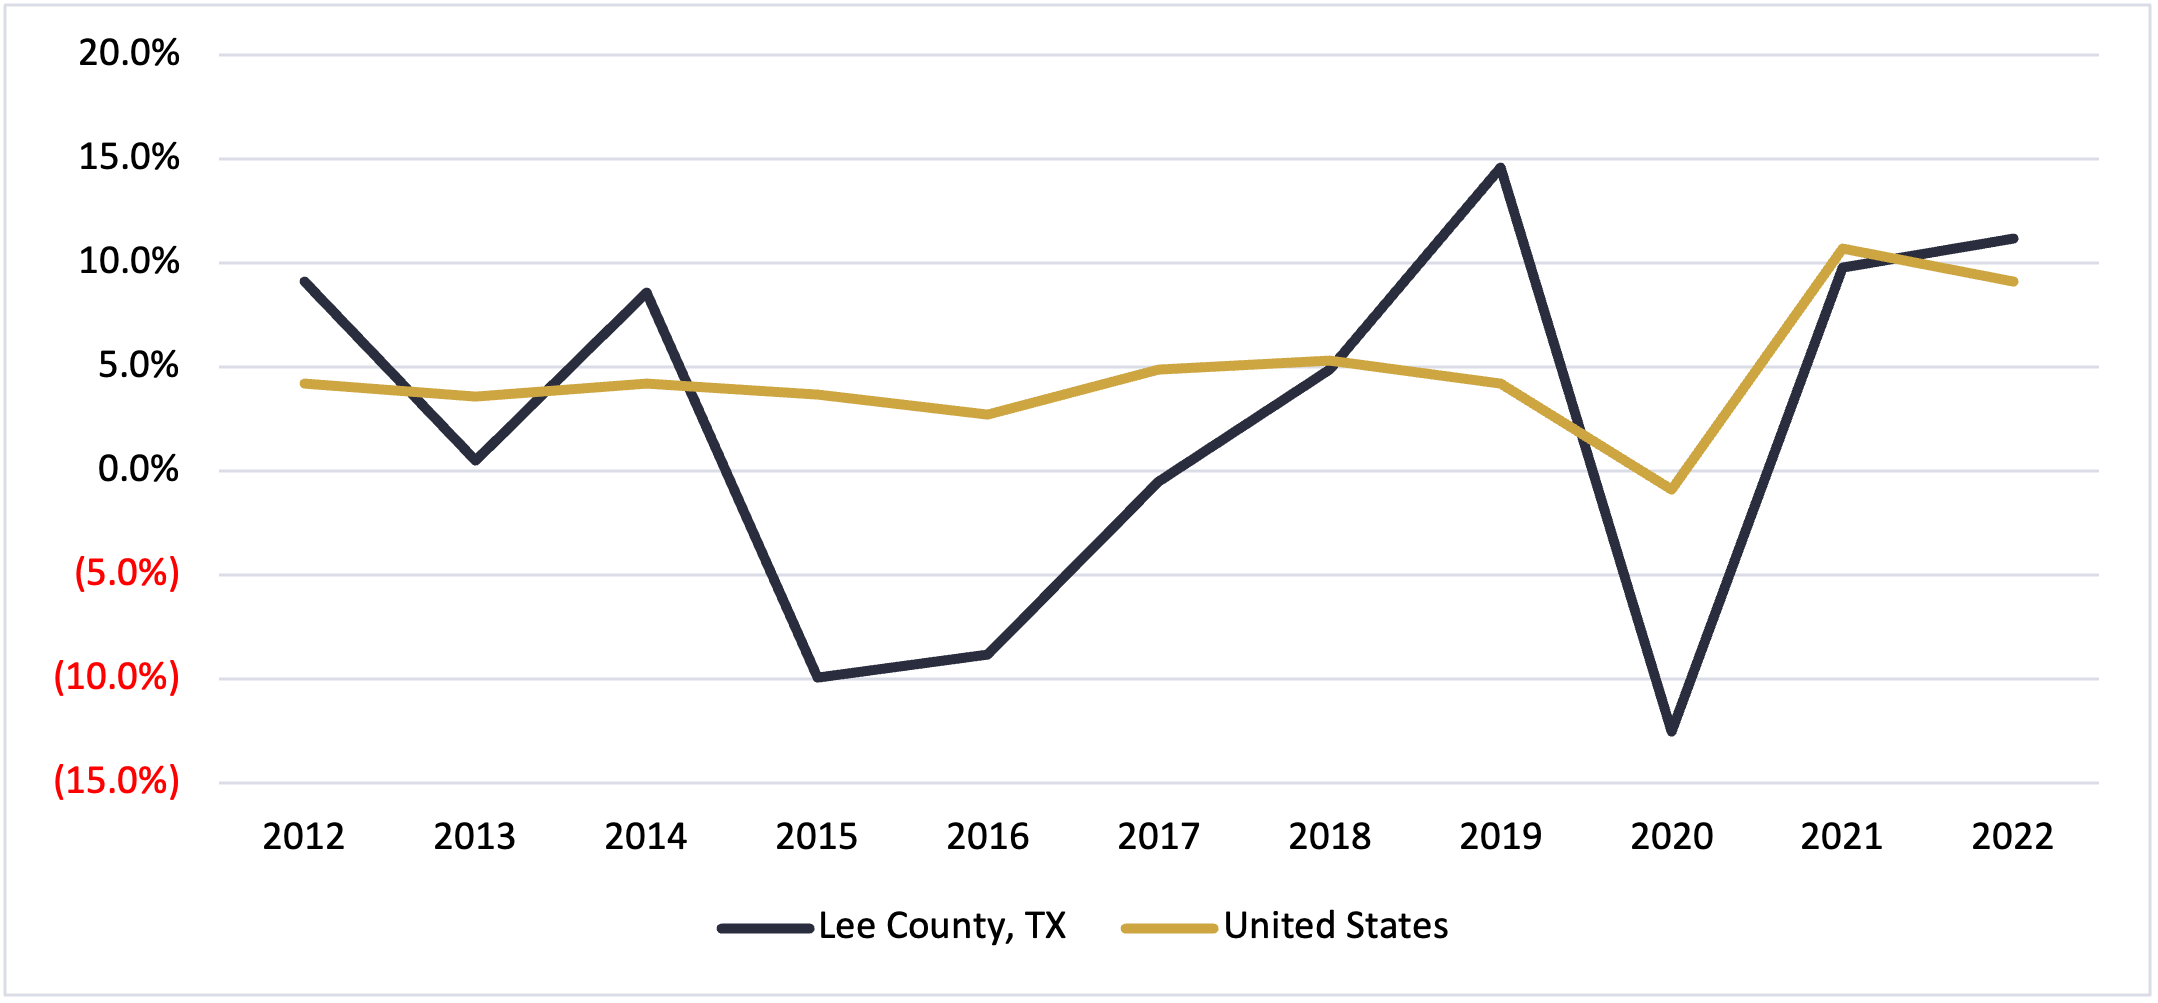
Source: BEA Regional Economic Accounts
In Lee County, the industry that generates the most GRP is Construction, followed by Real estate and rental and leasing, and Mining.
Figure 8: Gross Regional Product by Industry ($1Ms), Lee County
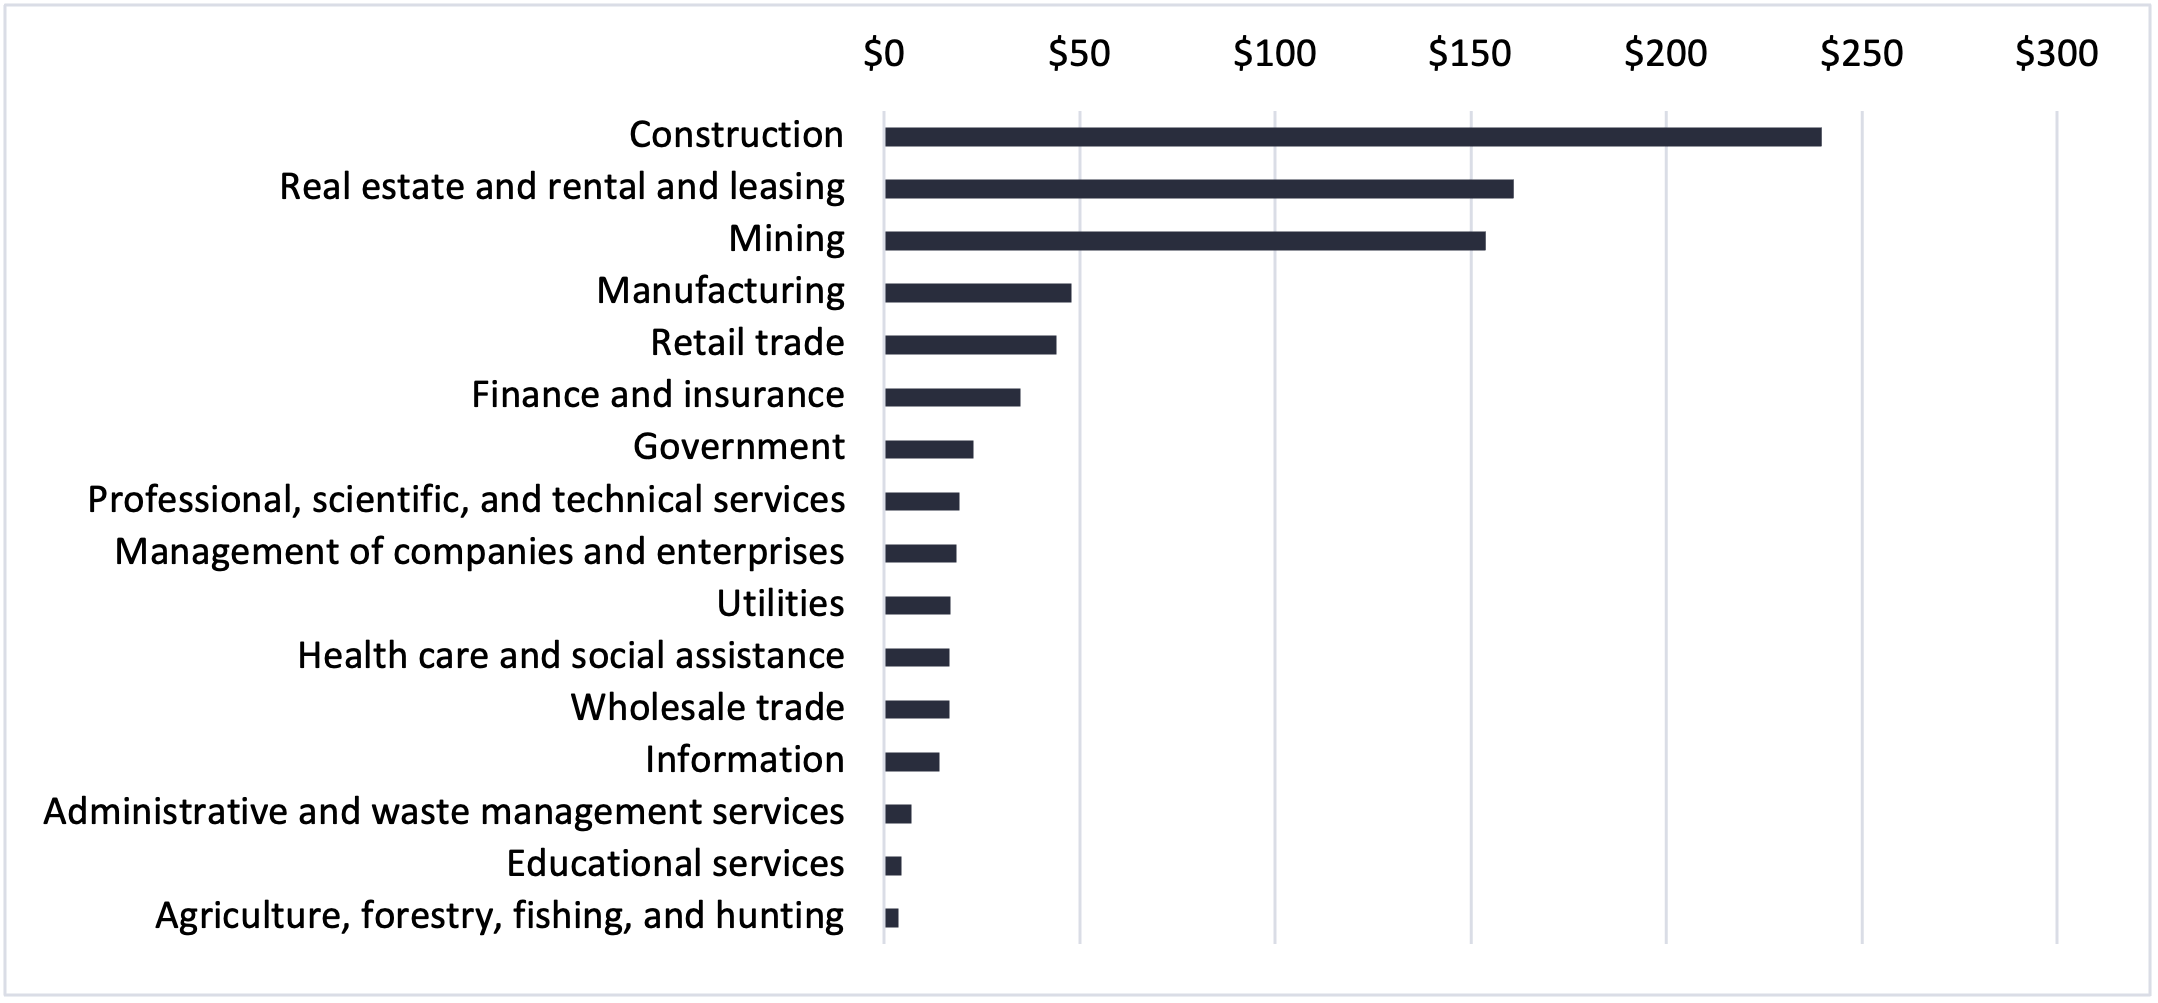
Source: BEA Regional Economic Accounts
One way to visualize this is by thinking of the GRP for Lee County as a $100 bill. Of that $100, Construction contributed $29, Real estate-related revenue $20, and Mining $19. The other $32 was brought in by all other industries.
Figure 9: Gross Regional Product Visualization, Lee County
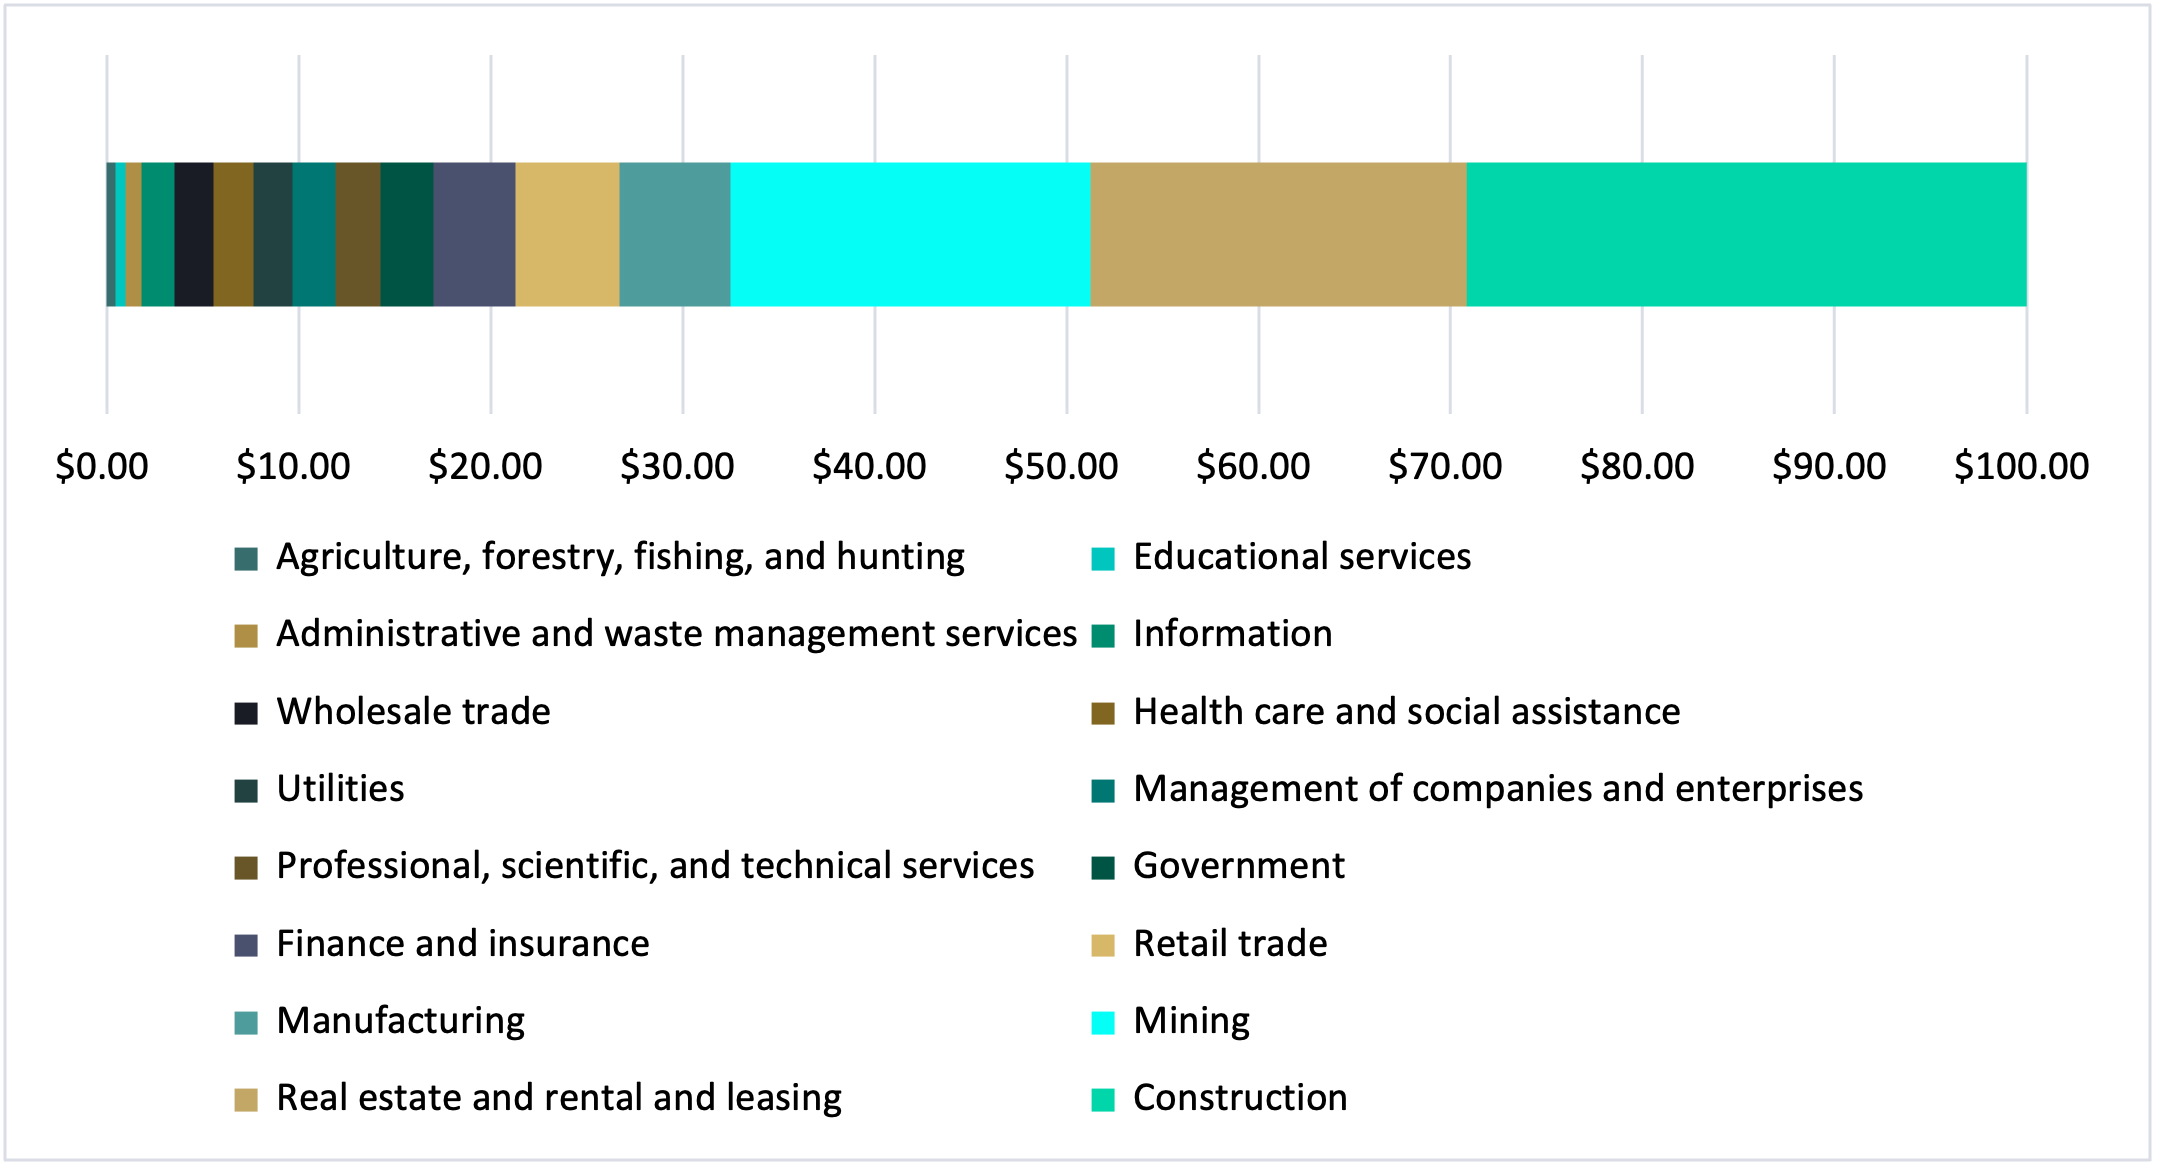
Source: BEA Regional Economic Accounts