Introduction
Fayette County is situated to the southeast of Austin. The county seat is La Grange. In 2021, the population of Fayette County was 24,687.
Demographic Profile
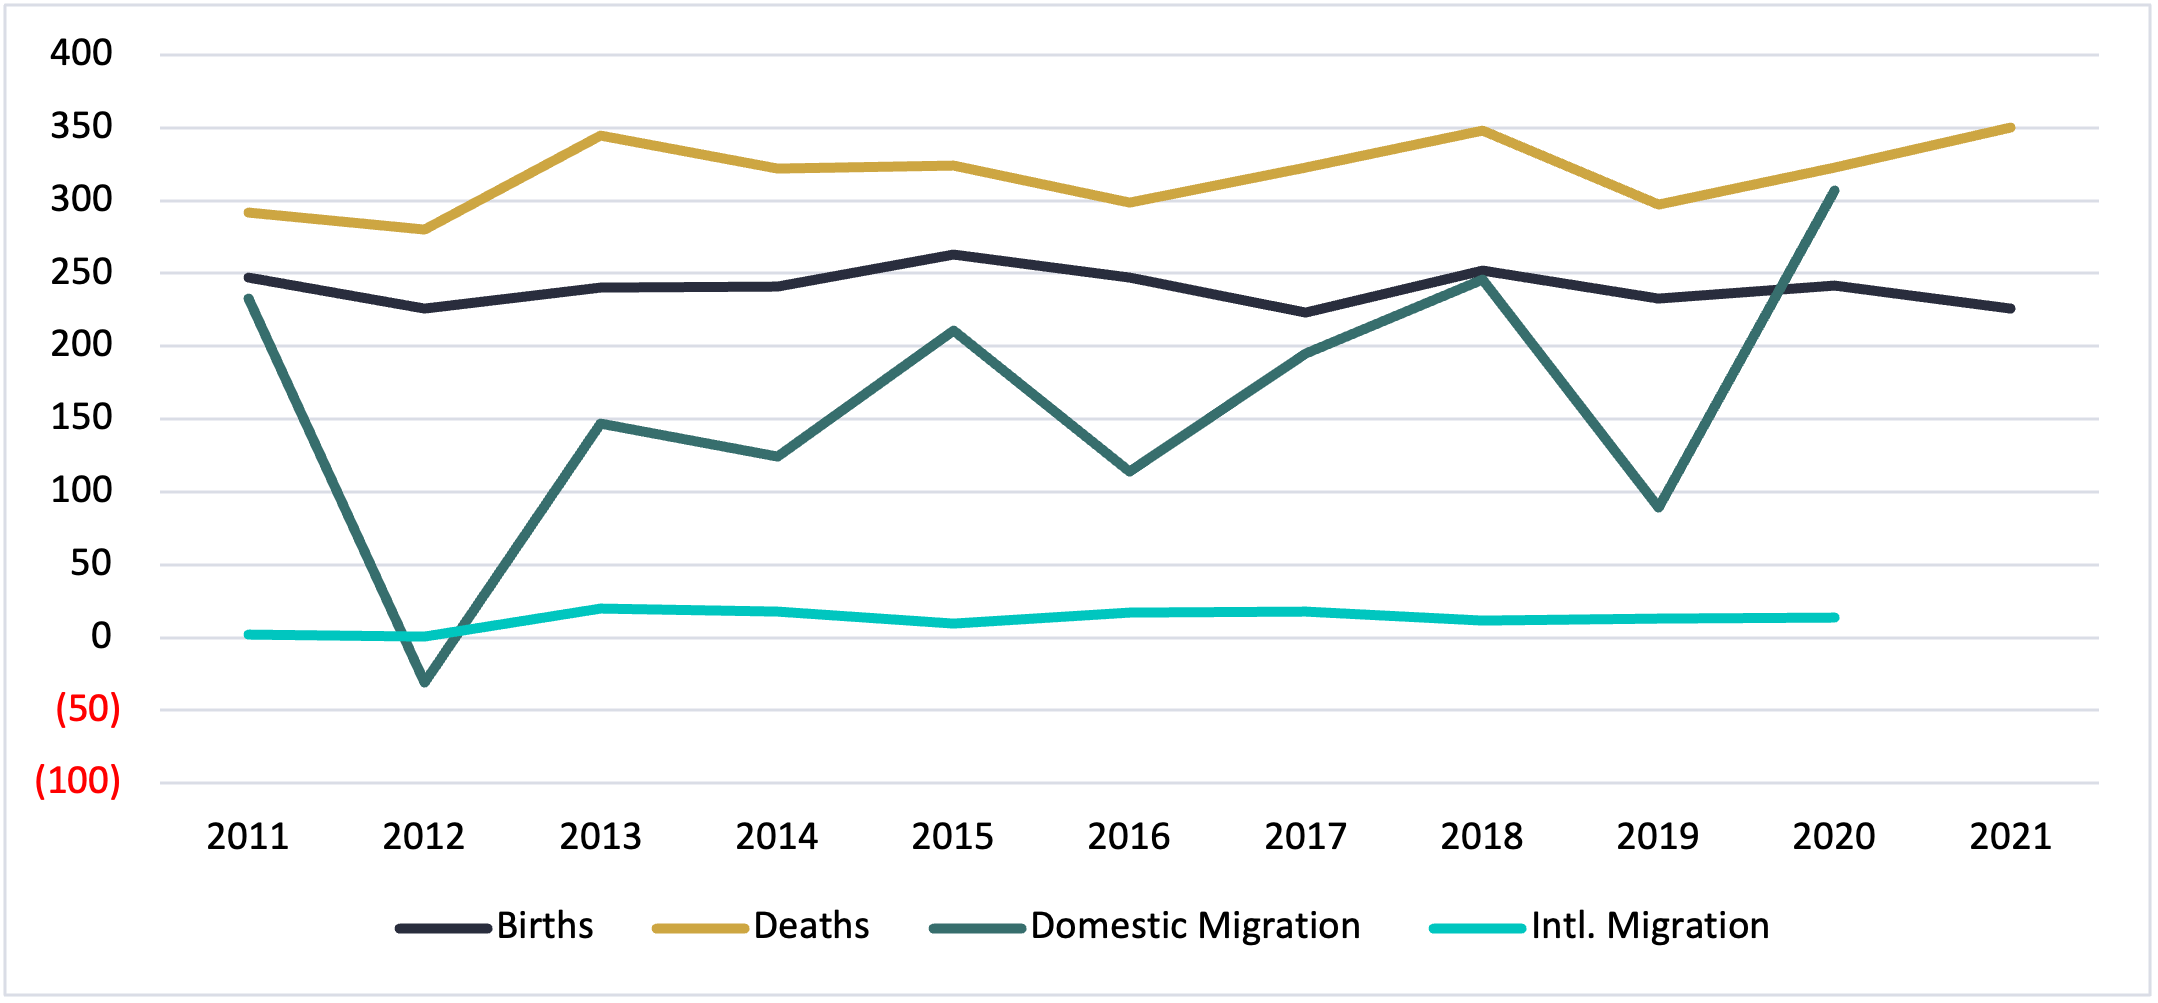
Population growth in Fayette County has been modest in the past decade, with no large fluctuations. The notable exception is 2021, which saw a 3.4% decrease. Migration data has not been released for 2021. However, it is unlikely that such a significant departure from trends is due to natural causes (more deaths than births), and more likely due to out-migration from the county.
Figure 1: Population Growth, 2011-2021, Fayette County
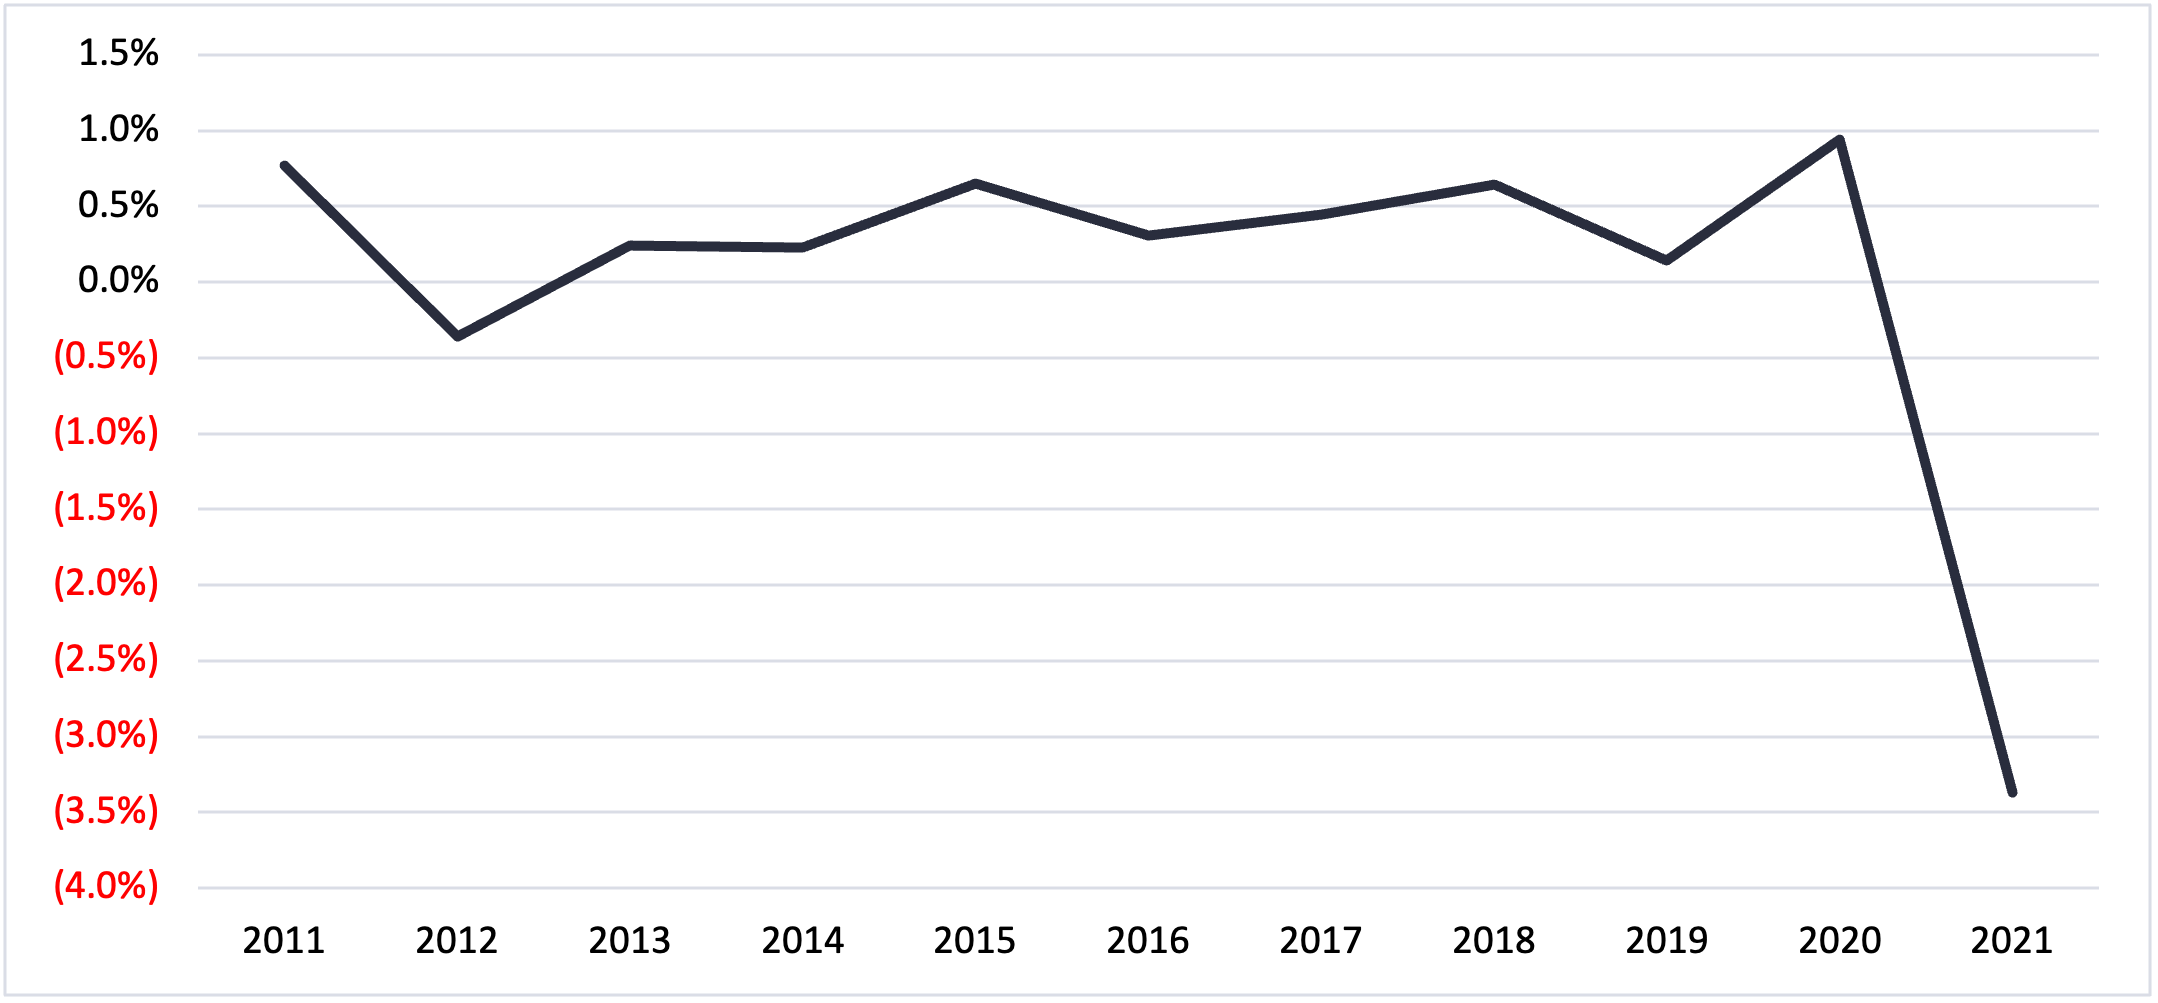
Figure 2: Population Change Components, 2011-2021, Fayette County
Employment Trends
The unemployment rate in Fayette County in 2021 was 3.5%, well below the national and state rates of 5.5% and 5.4%, respectively. Notably, a somewhat higher than usual percentage of the adult population is not in the labor force: 45.0%. For comparison, 36.4% of the adult population in the nation and 34.9% in the state are not in the labor force. A sizable portion of the population of Fayette County is over the age of 60 and has reached or is nearing retirement age, which may account for the larger percentage of the population not in the labor force.
Table 1: Employment Status of Fayette County, 2021
|
Subject |
Estimate |
Percent |
|
Population 16 years and over |
20,113 |
--- |
|
In labor force |
11,064 |
55.0% |
|
Civilian Labor Force |
11,064 |
55.0% |
|
Employed |
10,678 |
53.1% |
|
Unemployed |
386 |
1.9% |
|
Not in labor force |
9,049 |
45.0% |
|
Unemployment rate |
--- |
3.5% |
Educational Attainment
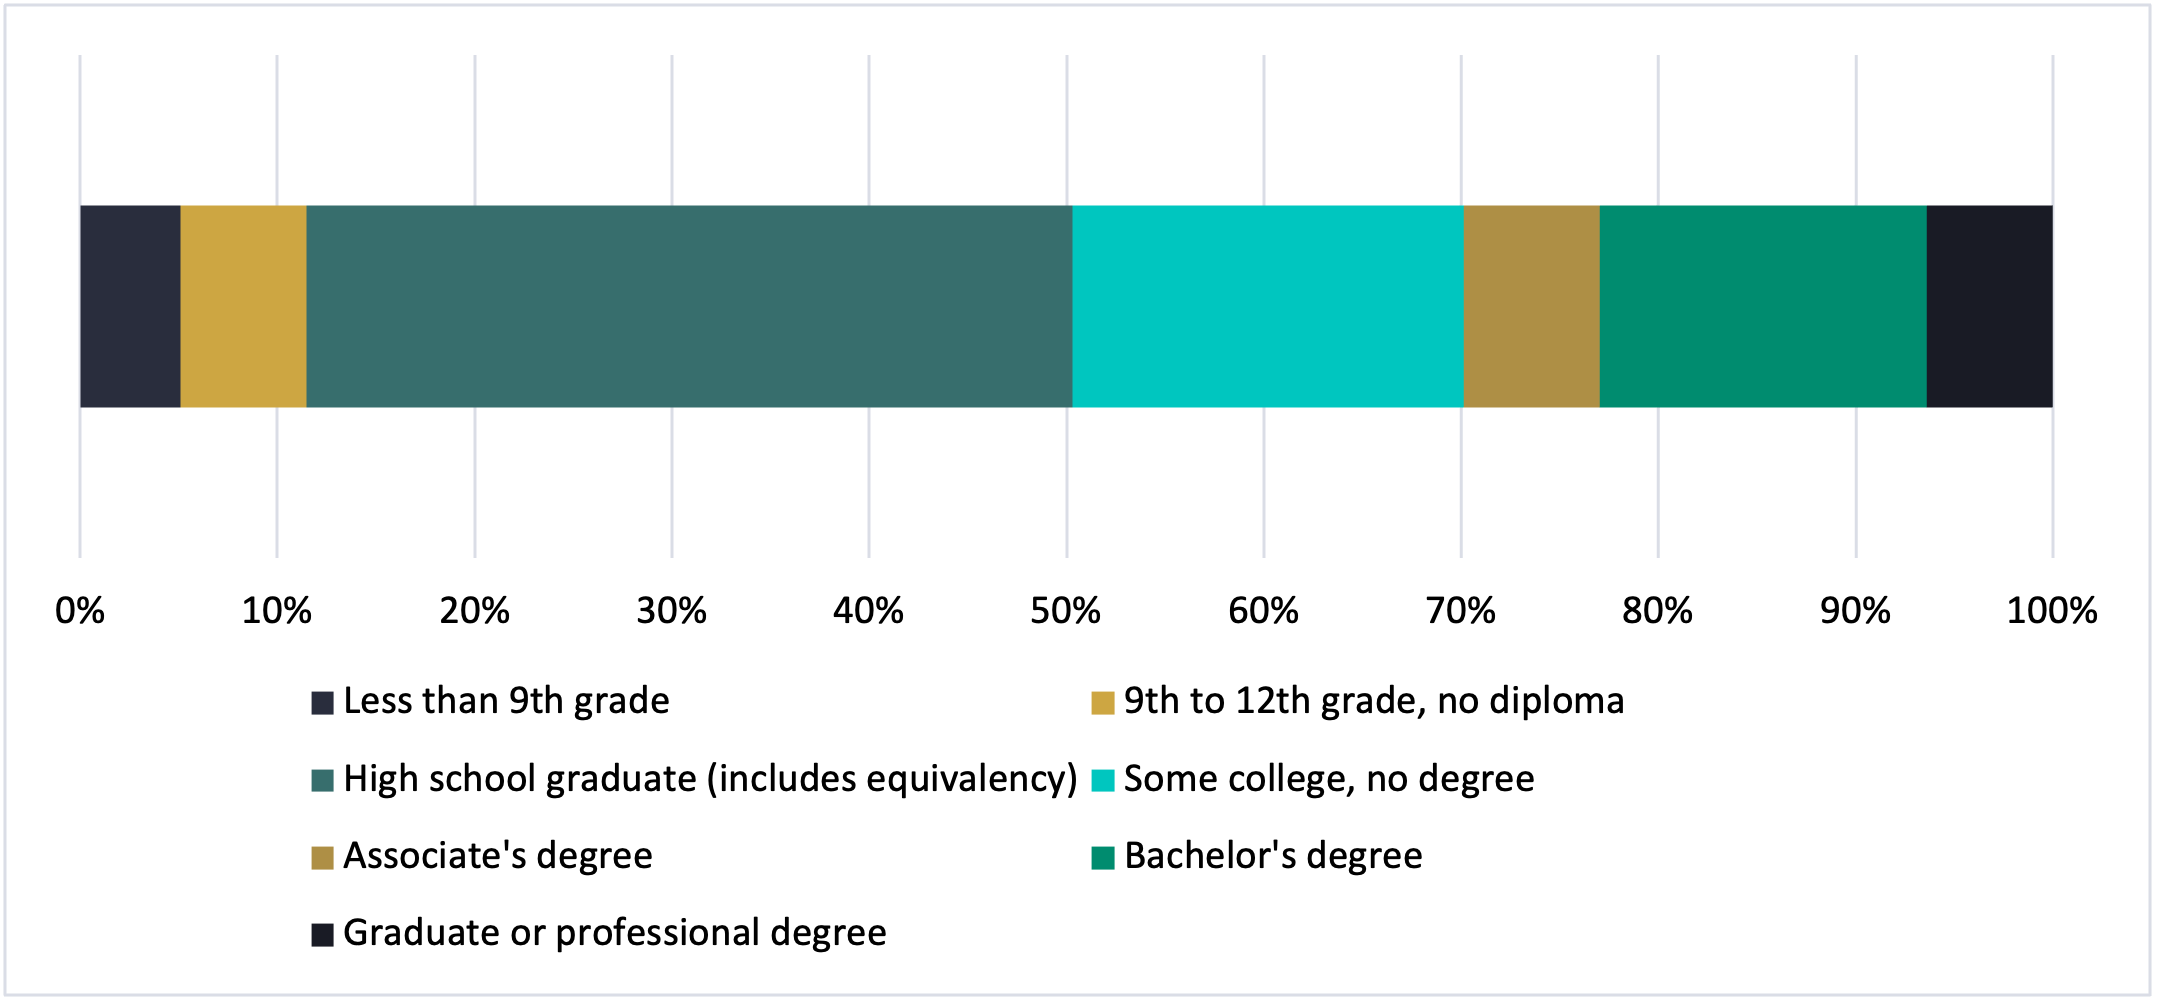
In Fayette County, 88.5% of the population (over 25 years-old) holds at least a high school degree, and 23% of the population has a bachelor’s degree or higher. While Fayette has a higher percentage of high school graduates than the state as a whole (84.8%), it is comparable to the US average (88.9%). However, the percentage of people with at least a bachelor’s degree is lower than both Texas (31.5%) and the US (33.7%).
Figure 3: Educational Attainment in Fayette County
Wage Trends
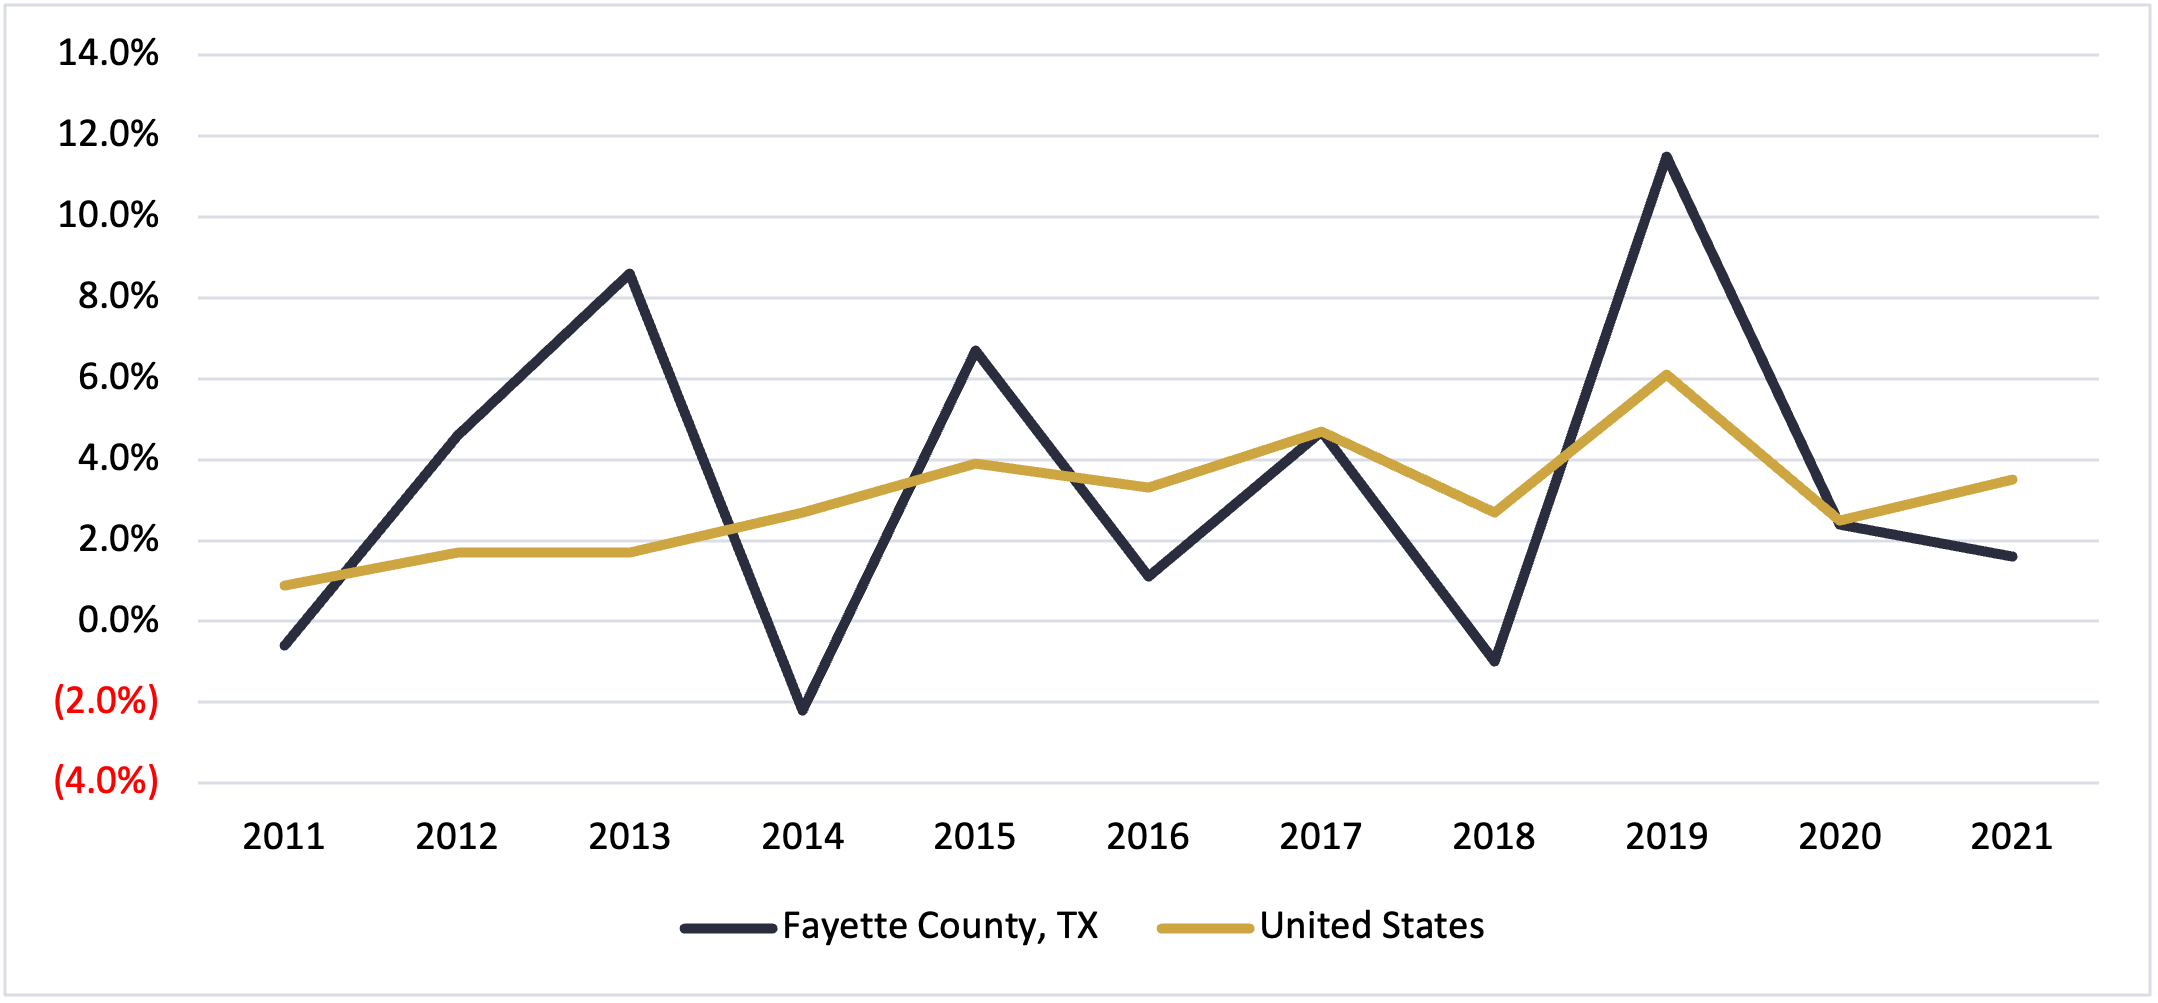
Given the smaller population, growth in median household income (MHI) in Fayette County fluctuates more than the US. However, it is interesting to note that in 2019, the last pre-Covid year, MHI in Fayette County had significantly increased by 11.5%. In both 2020 and 2021, MHI increased, but by a smaller percentage point growth than in 2019 (3.5% and 1.6%, respectively).
Figure 4: Median Household Income, 2011-2021, Fayette County vs. US
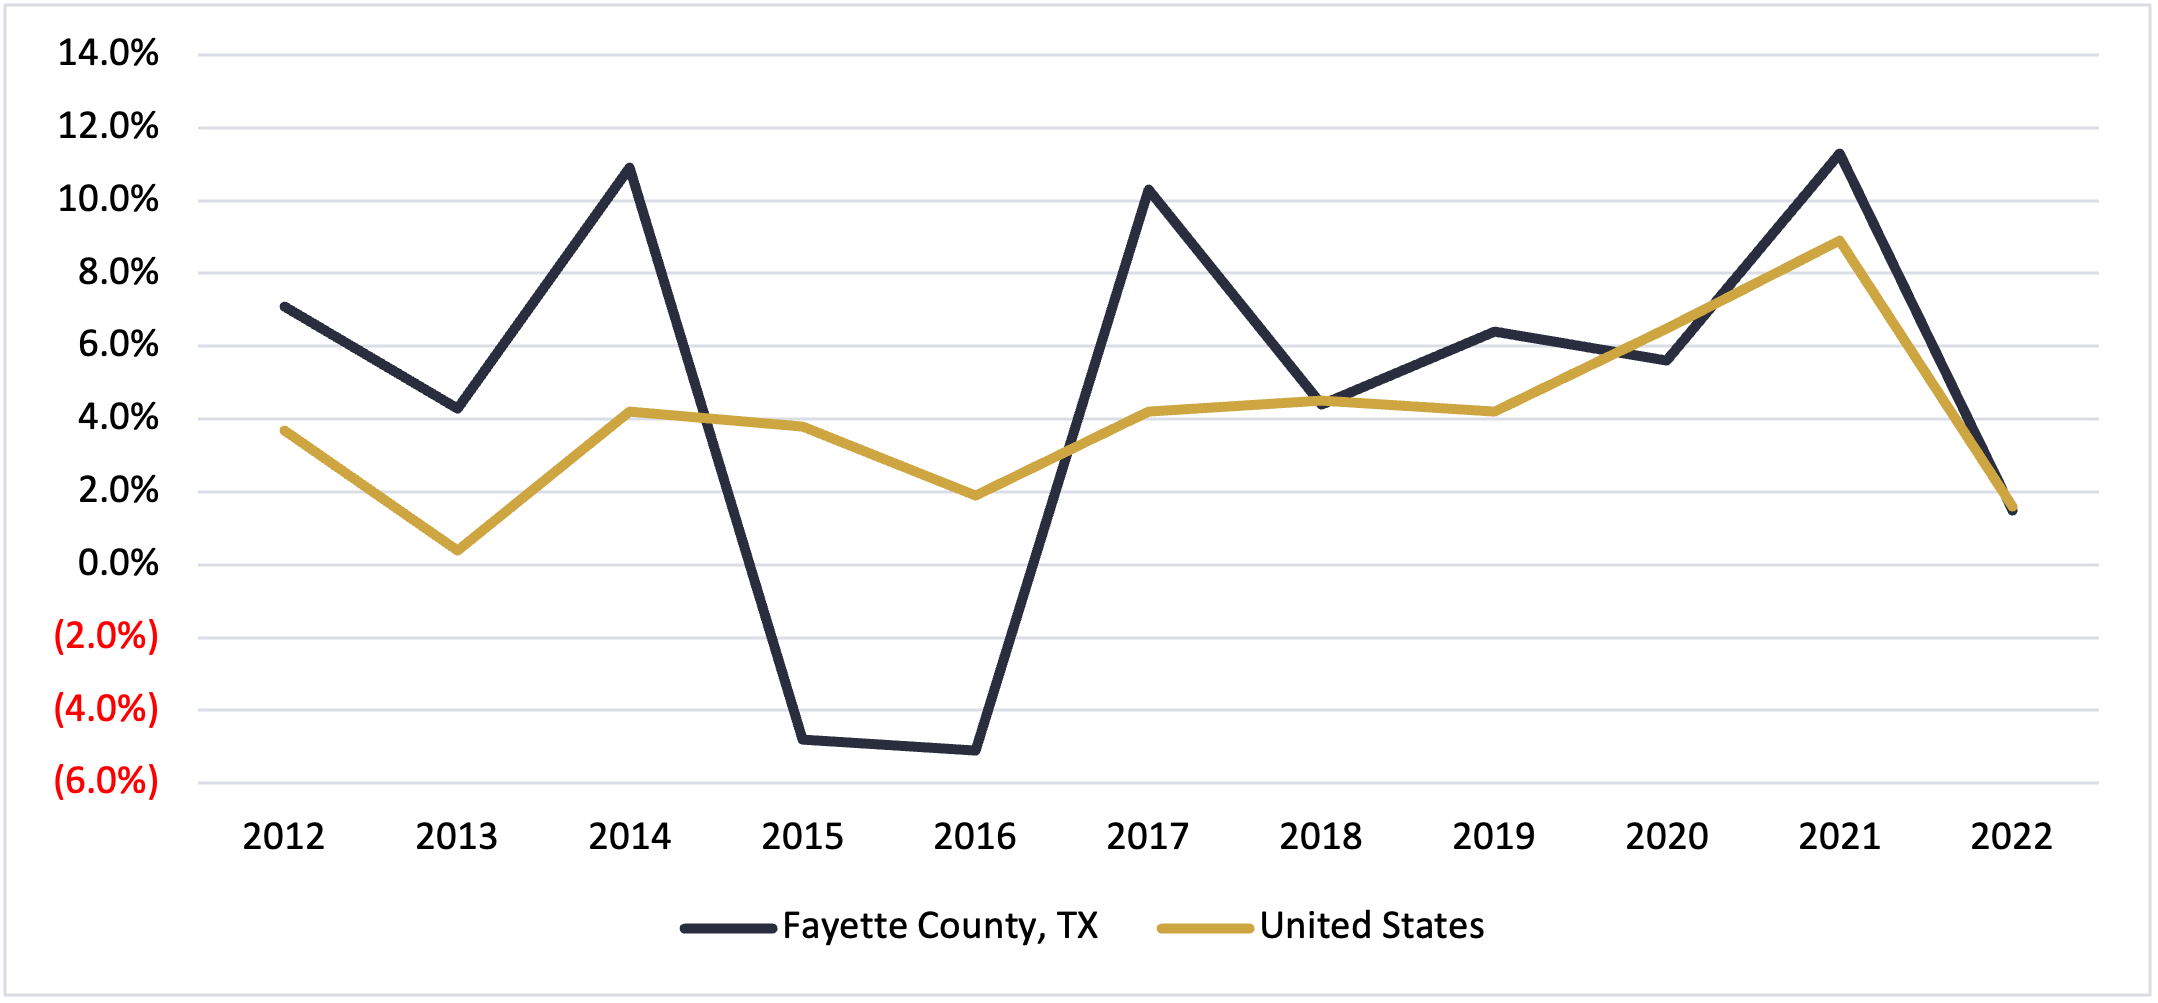
Per capita income growth in Fayette County spiked later, in 2021 (11.3%). Per capita income growth did not grow as substantially in 2022 as in 2021. However, it did grow by 1.5%, comparable to the national growth. The difference in trends between MHI and per capita income growth could be due to income growth from sources such as government transfer payments (such as SNAP, and Social Security), which the MHI from the Census Bureau does not track.
Figure 5: Per Capita Income Growth, 2012-2022, Fayette County vs. US
Industry and Occupation Snapshots
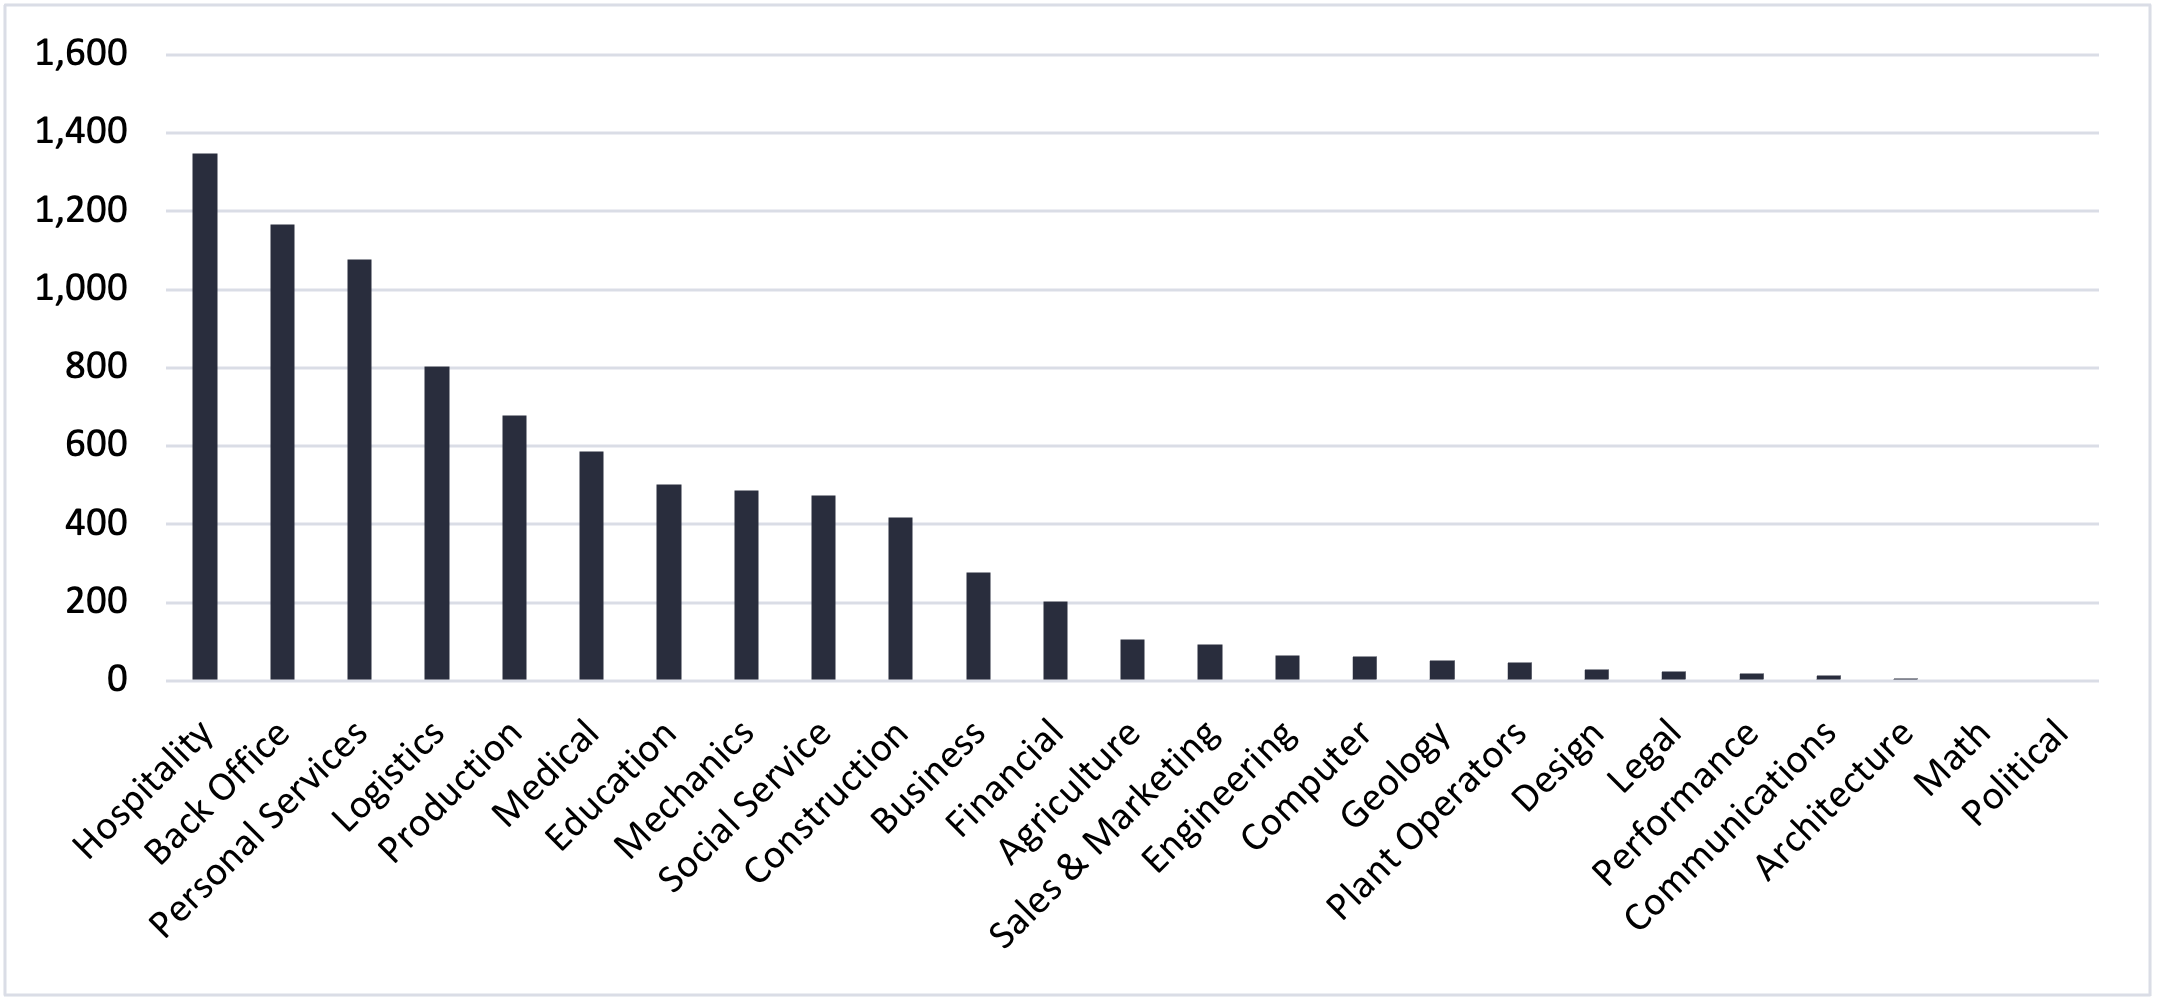
The top five occupational clusters represent an favorable mix of service and production jobs. Hospitality, Back Office, and Personal Services rank the highest in Fayette County’s occupation clusters, followed by Logistics and Production
Figure 6: Occupation Cluster Employment, 2022, Fayette County
Gross Regional Product
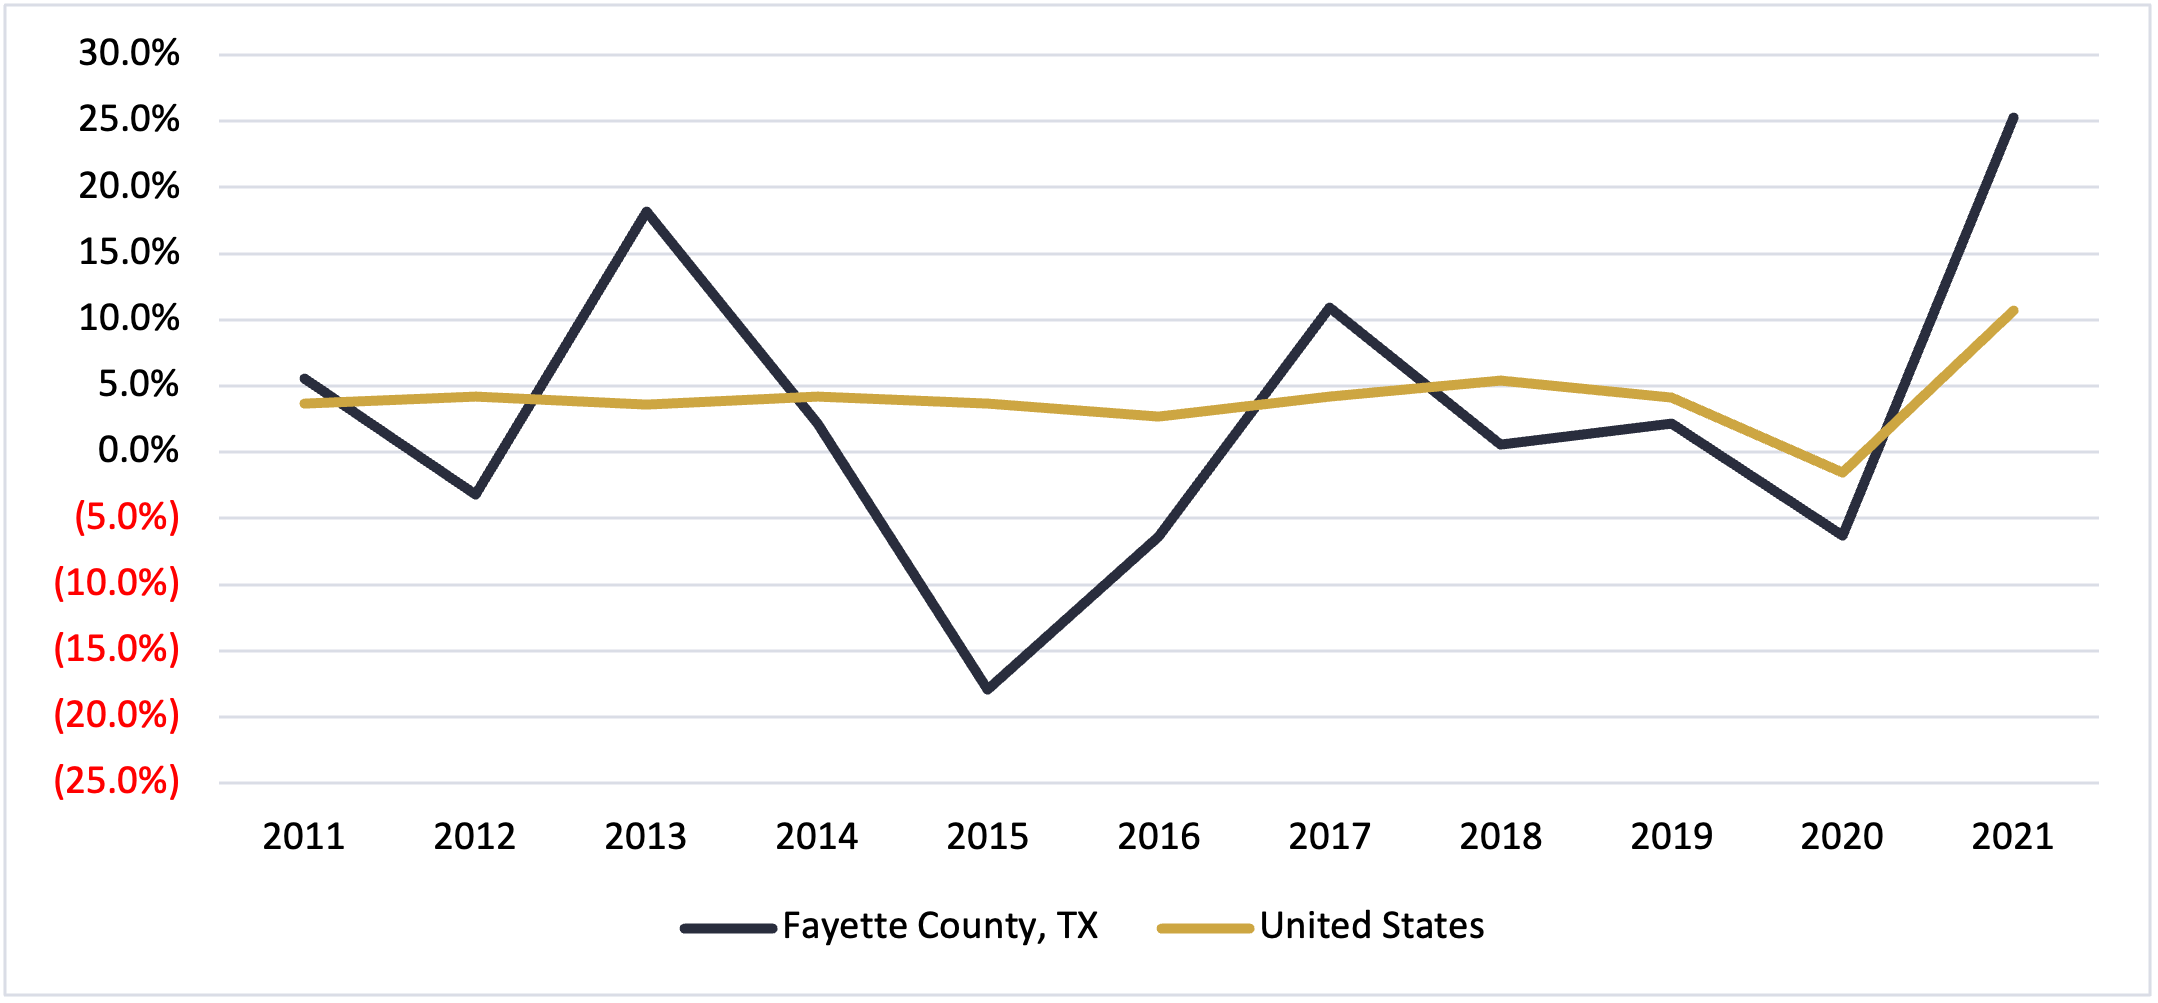
Like the rest of the nation, Fayette County’s growth in Gross Regional Product (GRP) decreased in 2020 -6.3%. However, the county’s GRP made a rapid recovery in 2021, with a 31.6 percentage point increase from the previous year.
Figure 7: Growth in Gross Regional Product, 2011-2021, Fayette County vs. US
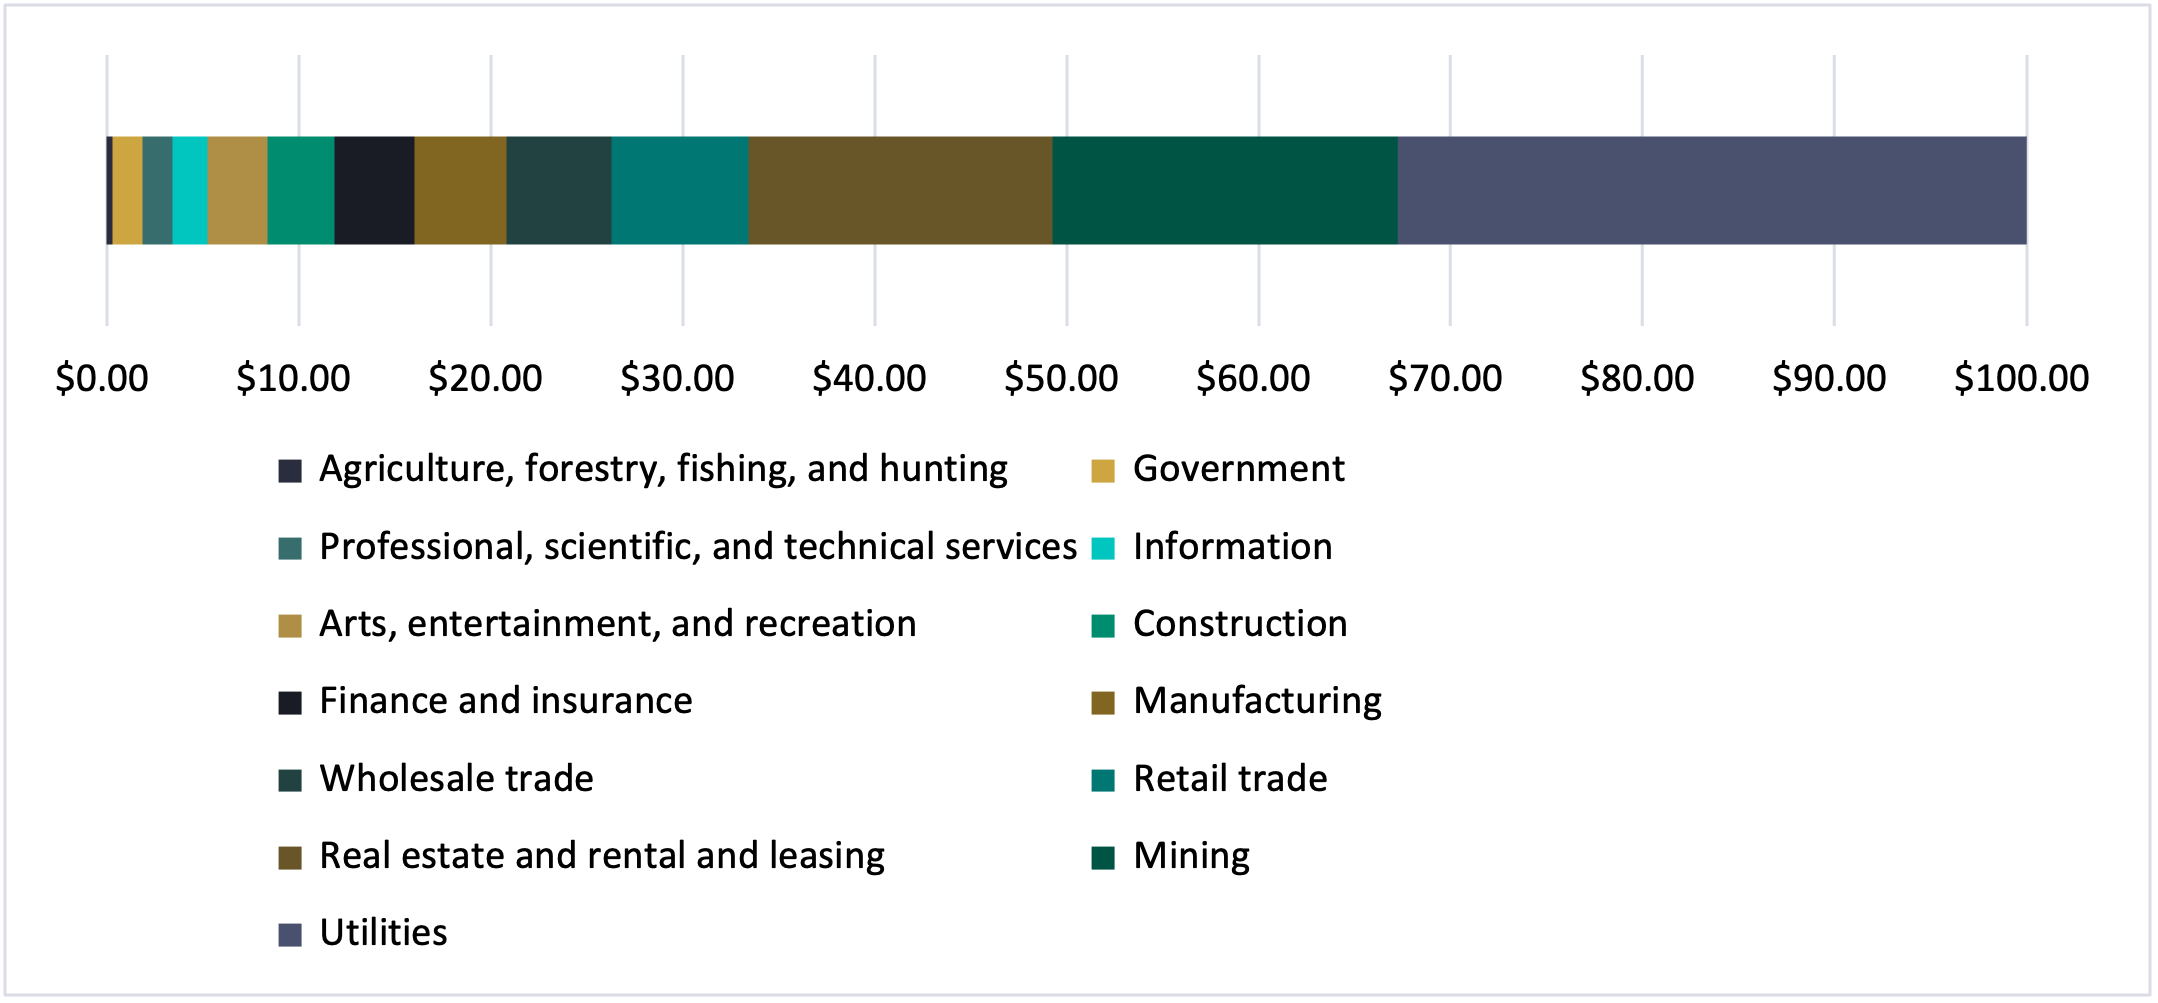
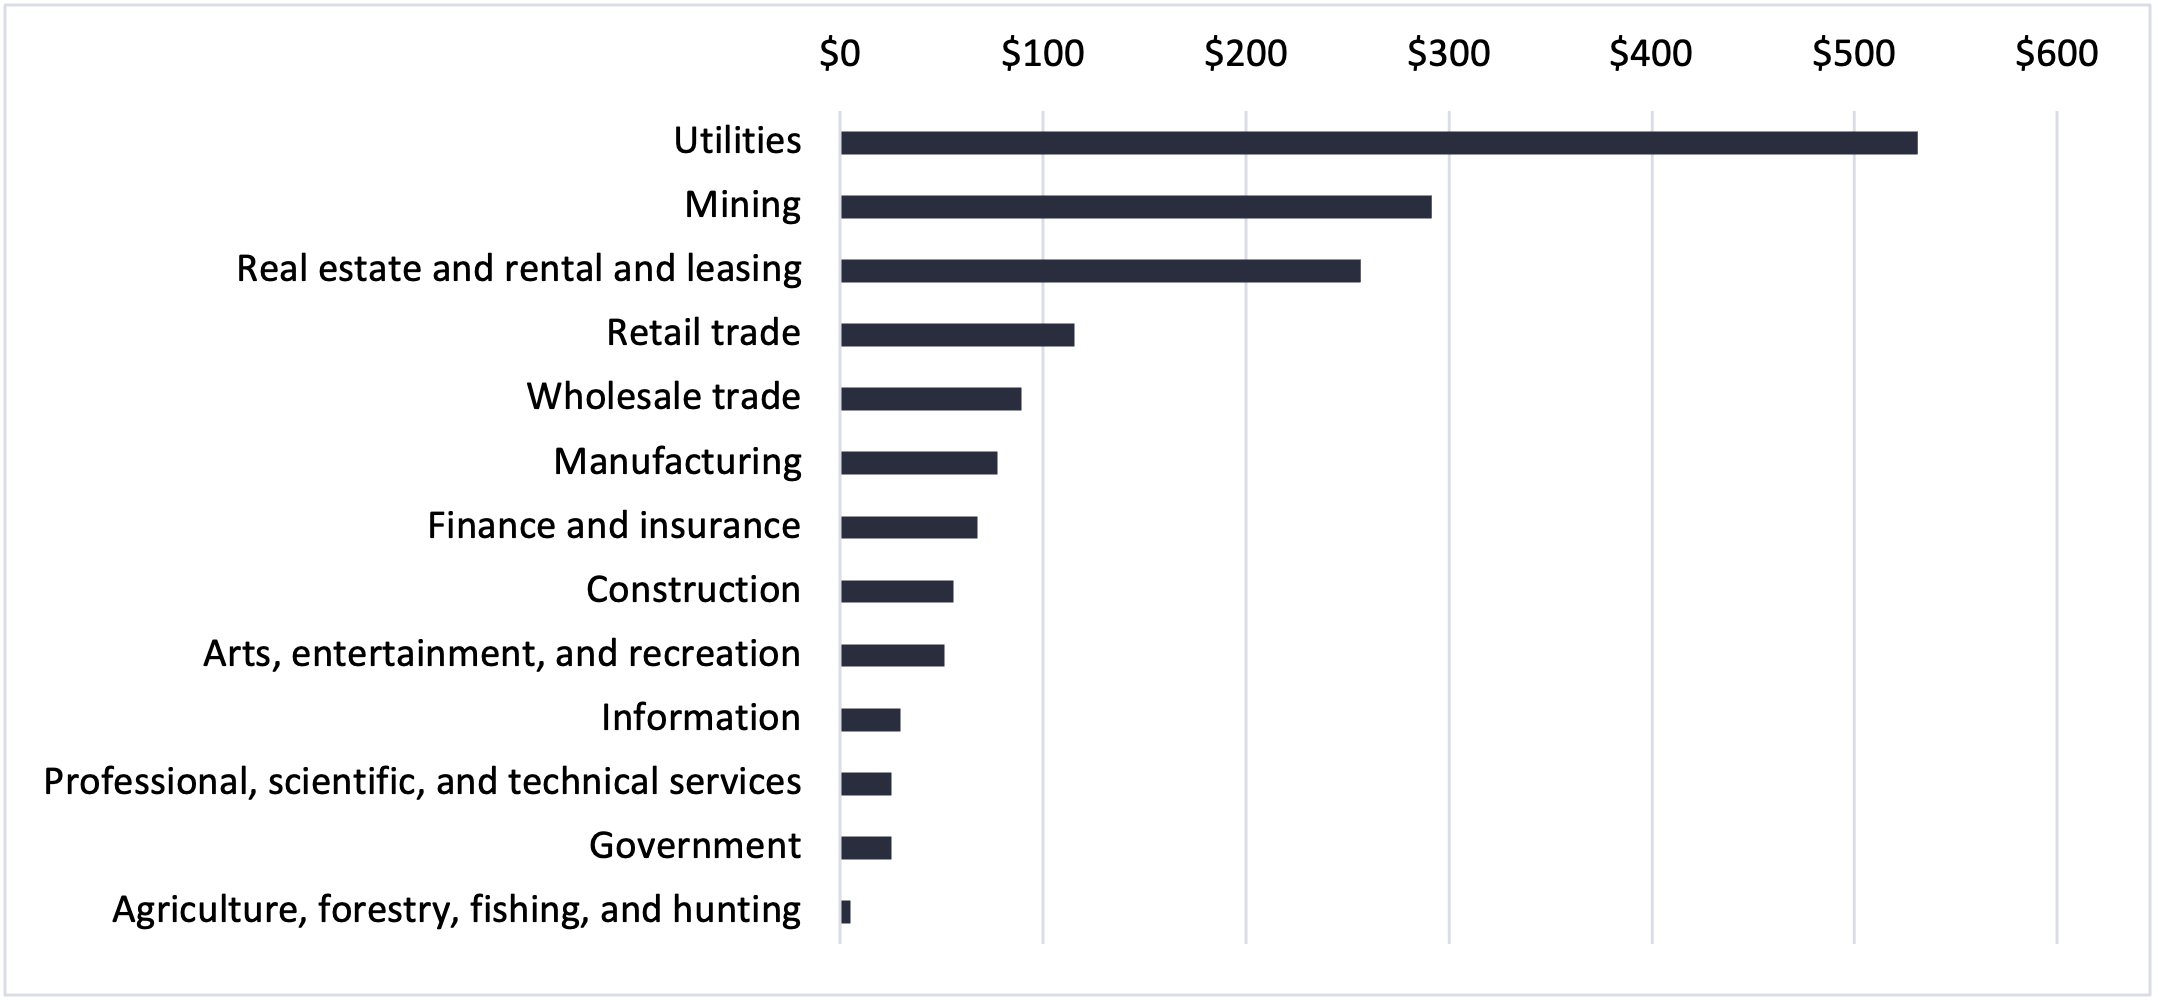
In Fayette County, the industry that generates the most GRP is Utilities, followed by Mining.
Figure 8: Gross Regional Product by Industry ($1Ms), Fayette County
One way to visualize this is by thinking of the GRP for Fayette County as a $100 bill. Of that $100, utilities-related revenue contributed $33, mining $18, manufacturing $16, and retail $7. The other $26 was brought in by all other industries.
Figure 9: Gross Regional Product Visualization, Fayette County