Introduction
This article is the third in a series of economic and social profiles of each county in the Rural Capital Area (RCA). These profiles are intended to provide a high-level overview of various aspects of each county in the RCA. Burnet County is located to the northwest of Austin. The county seat is in the city of Burnet.
Demographic Profile
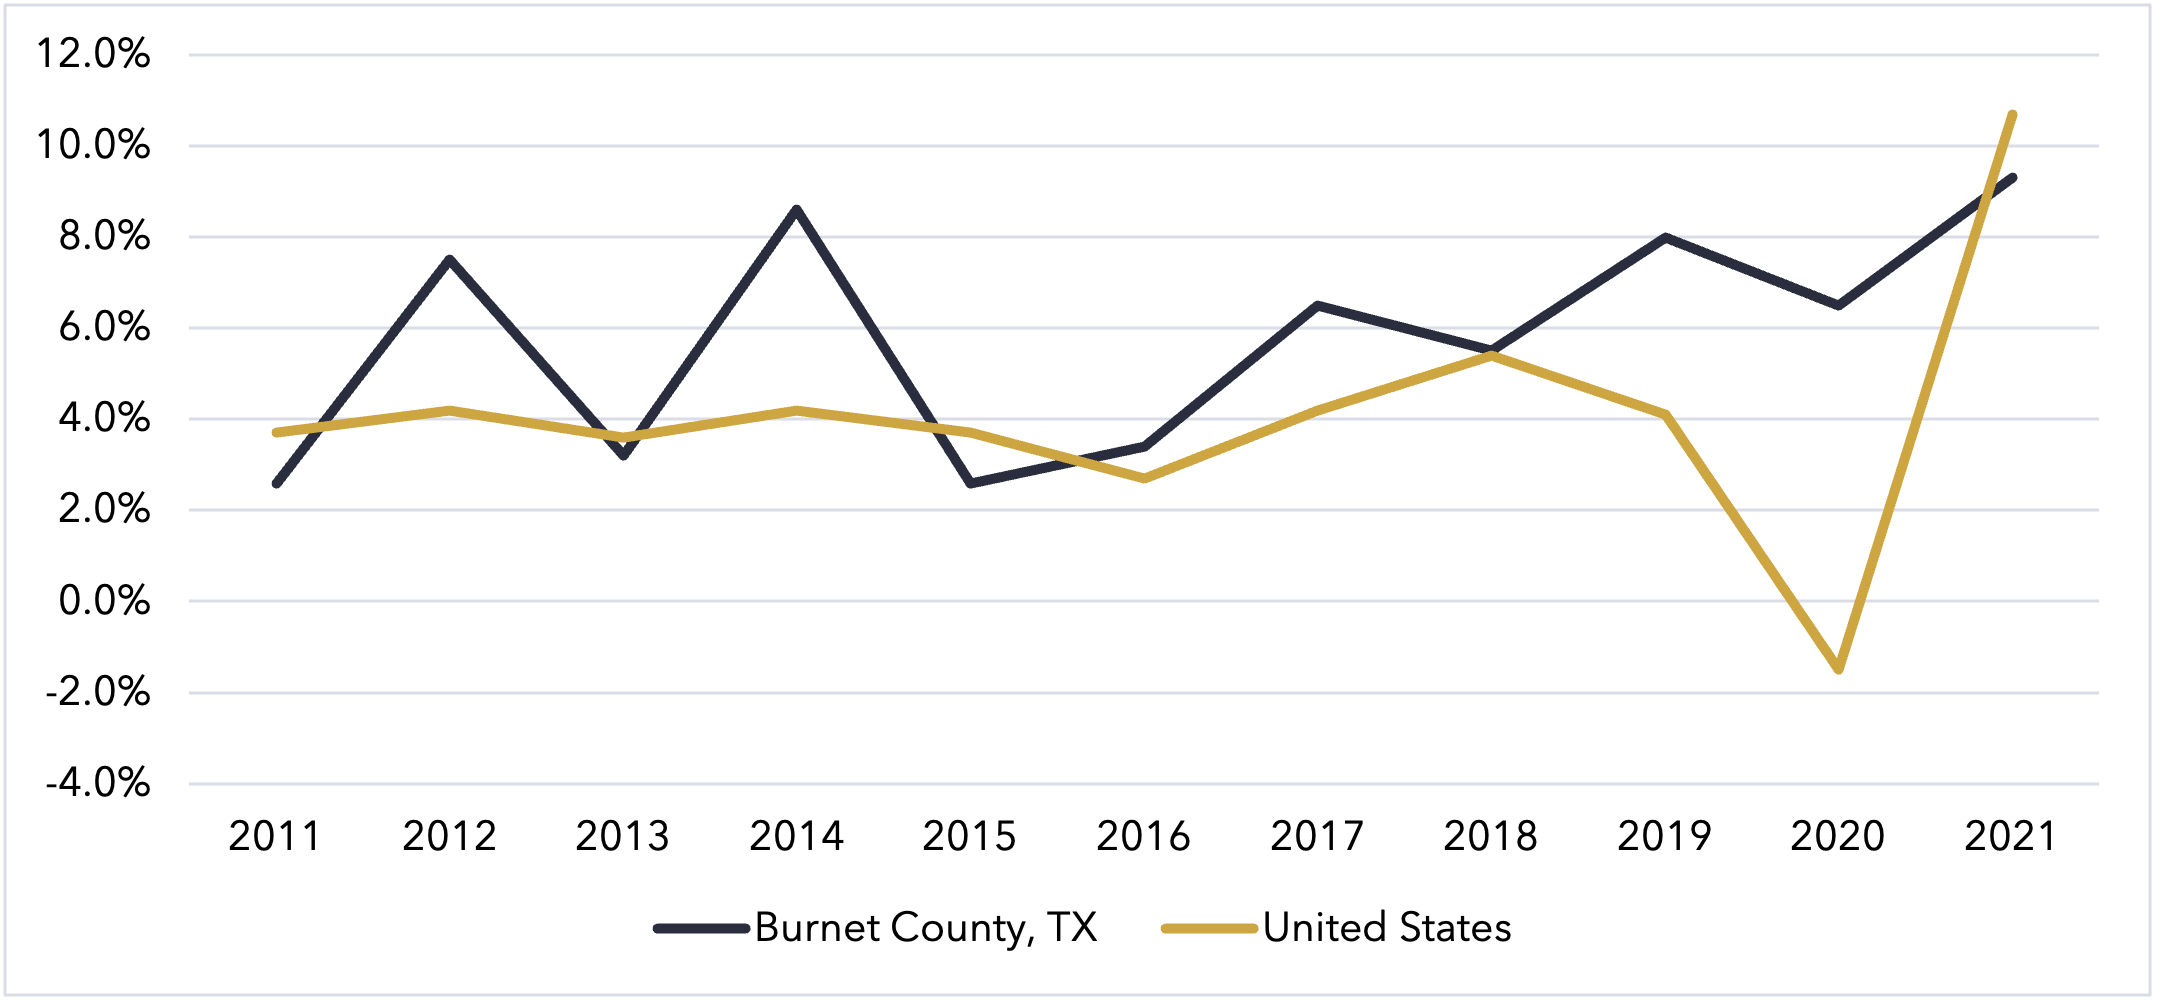
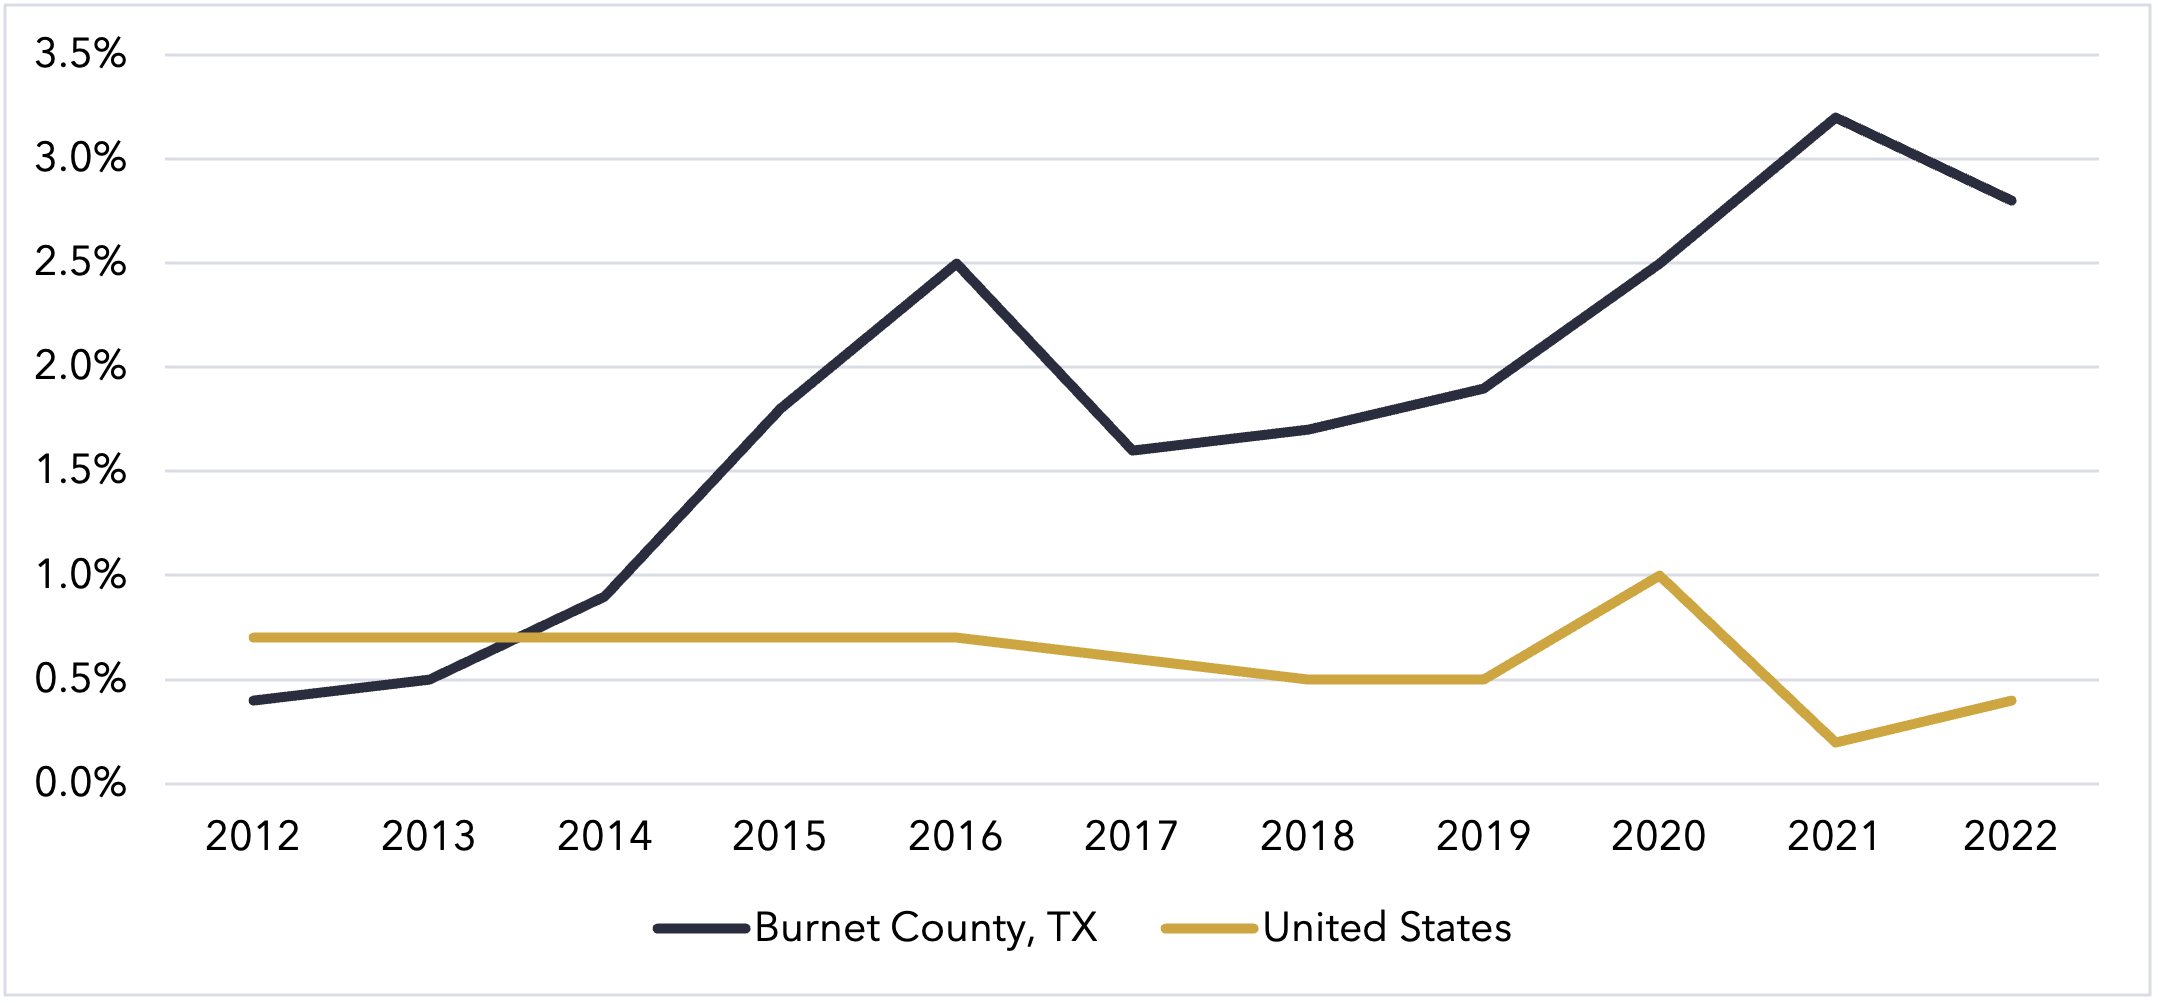
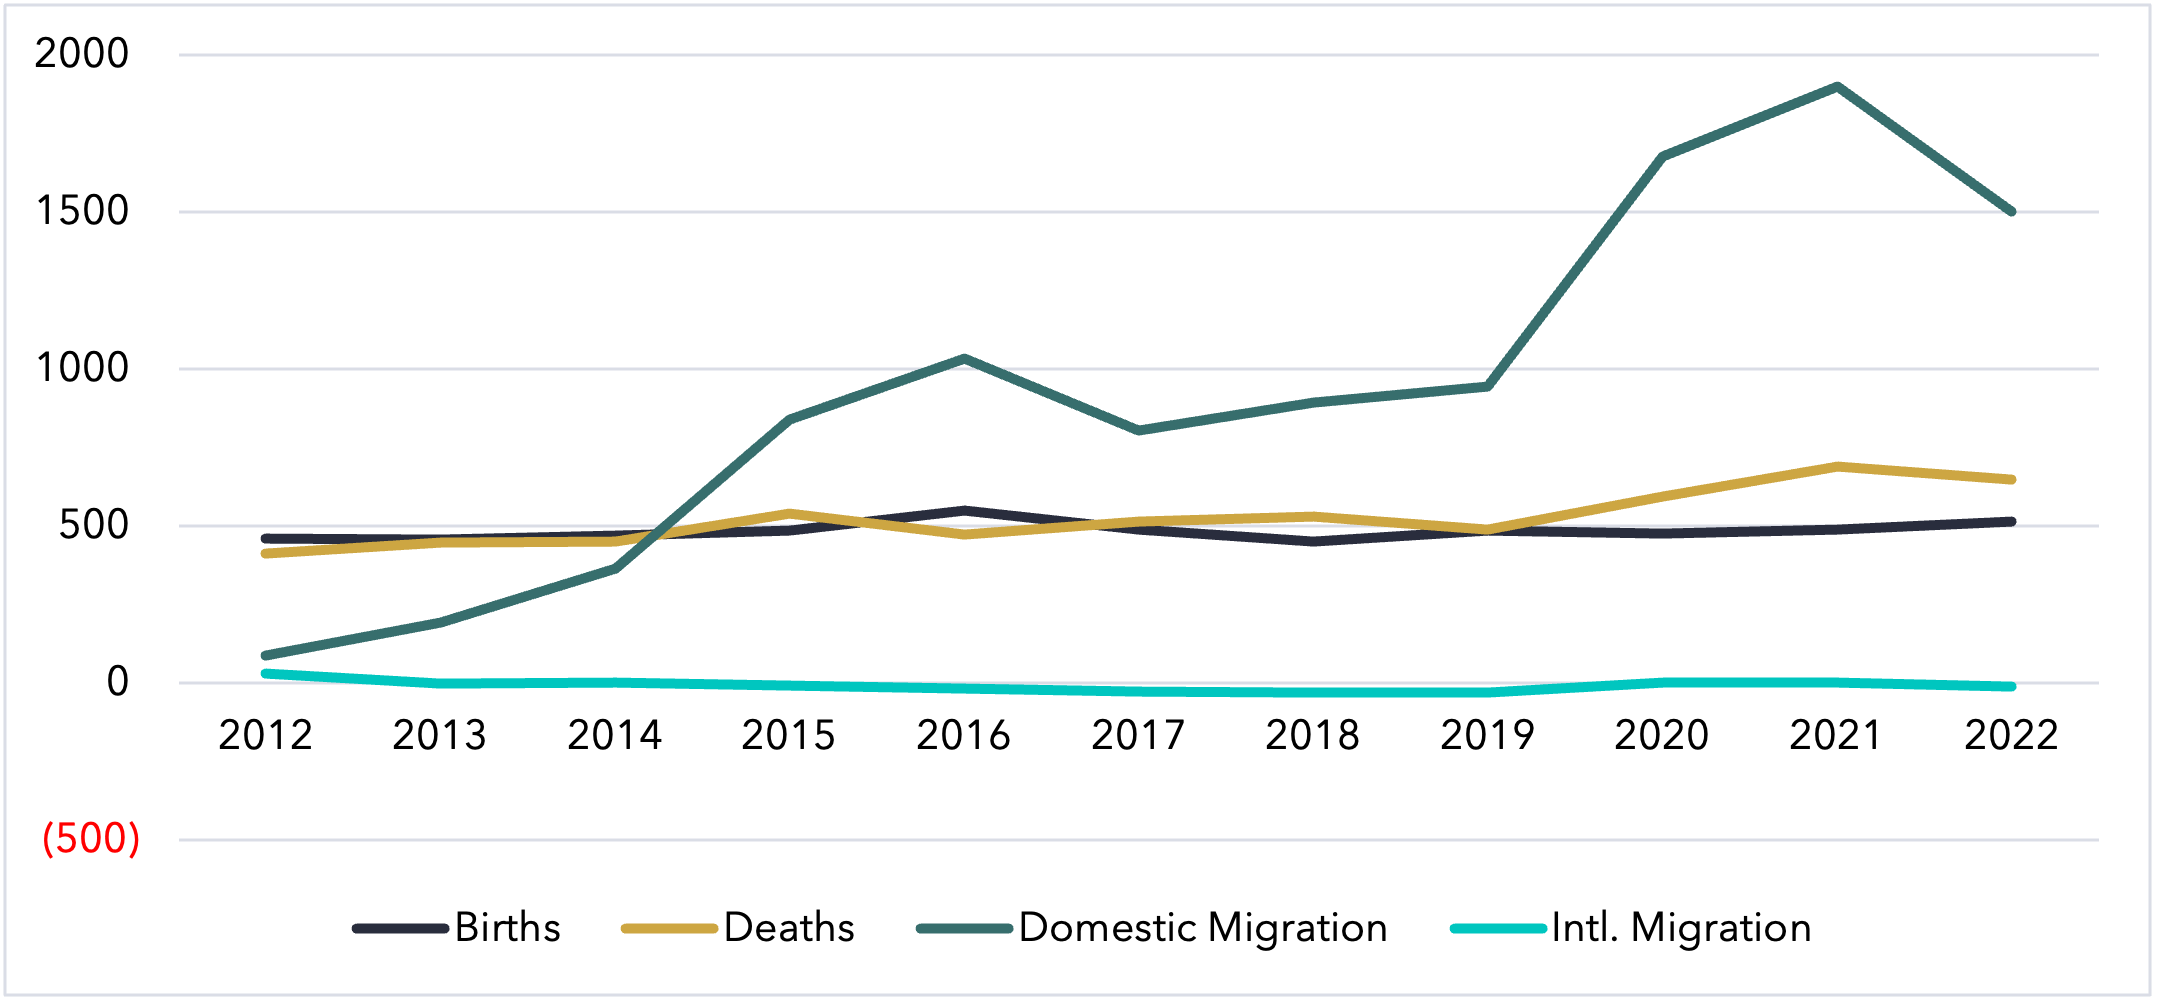
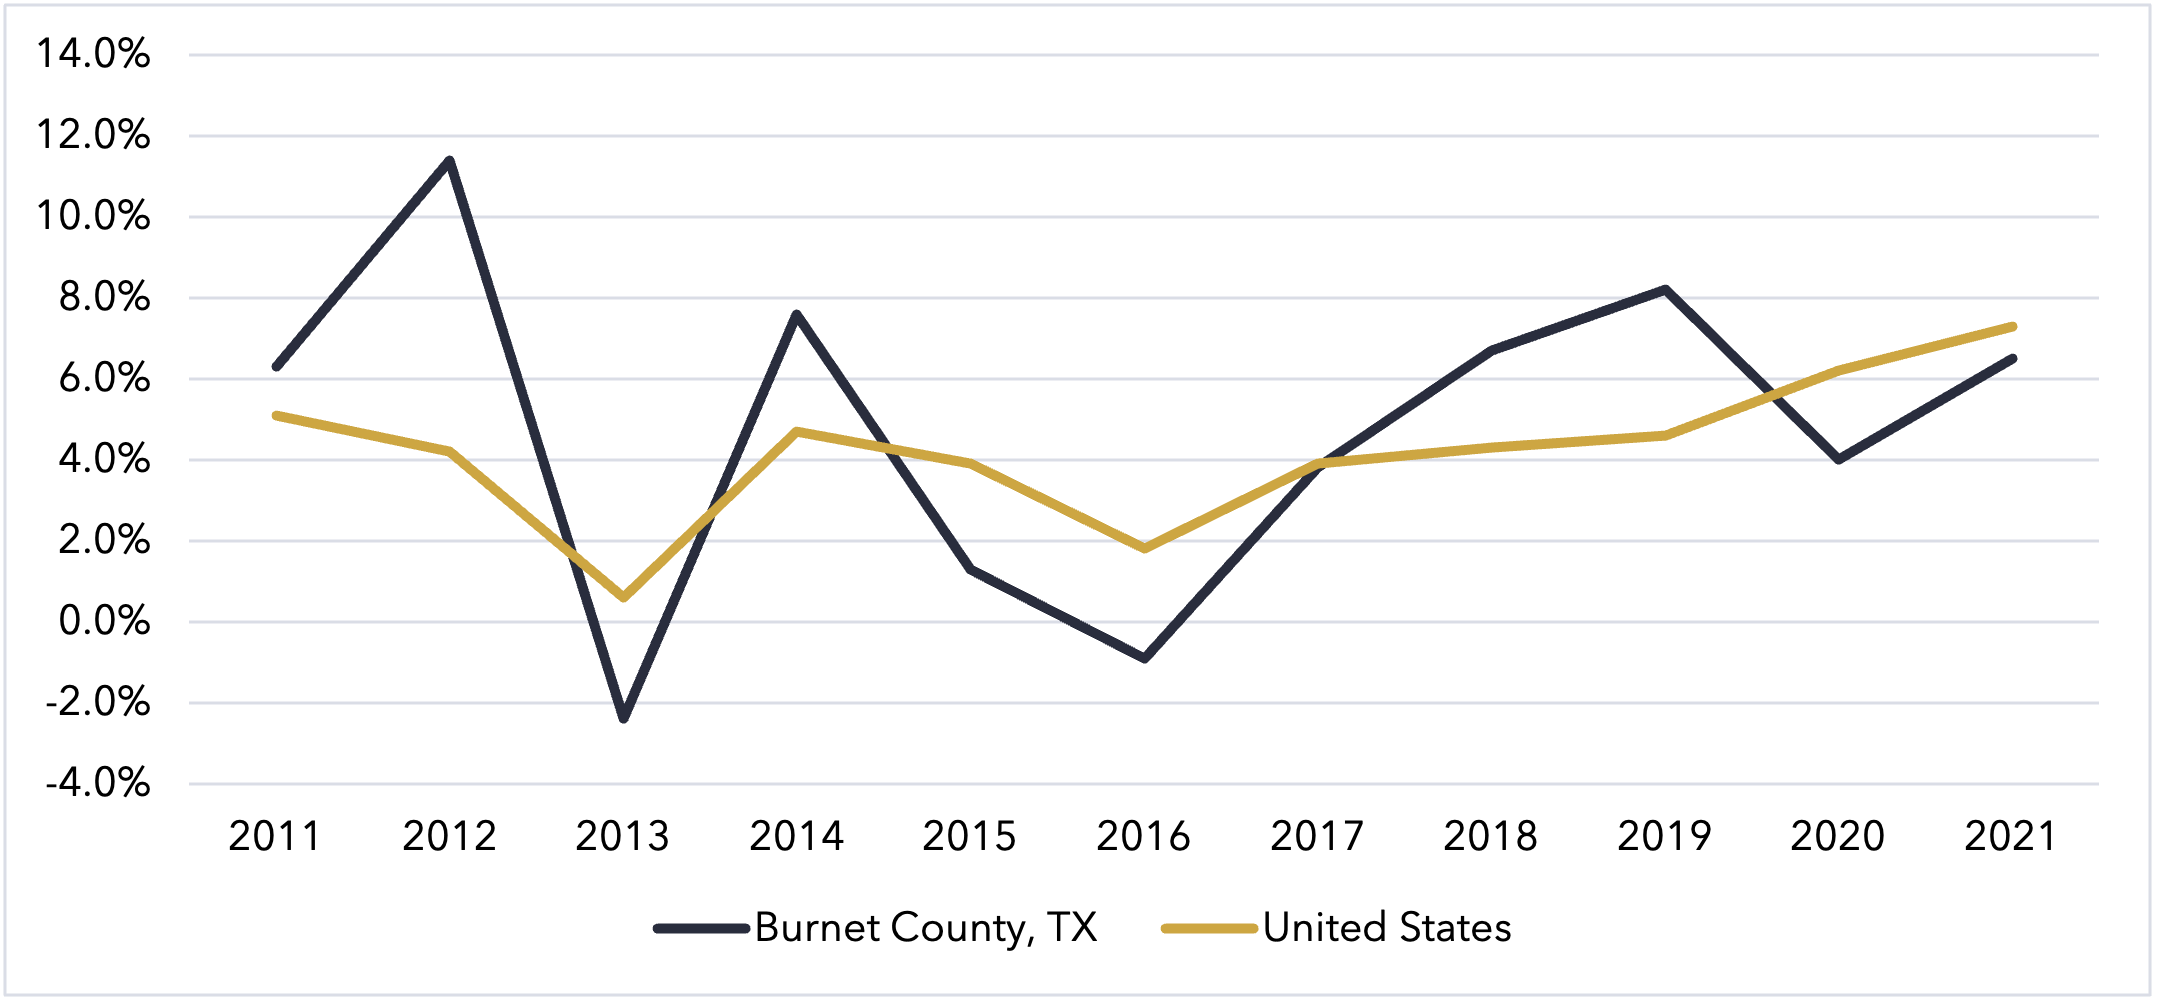
As of 2022, the population of Burnet County was 52,502. Burnet County has steadily gained population every year in the last decade, mainly due to domestic migration. Overall, Burnet County has maintained a higher percentage of population growth than the United States as a whole since 2014.
Compared to the rest of Texas, Burnet County has a slightly older population. The median age is 44.7 years in Burnet County compared to 35.0 in Texas and 38.4 years in the US. This can be seen in the population of children in the respective areas: 25.8% of Texas’ population is composed of people under 18 years, whereas that proportion is 21.0% in Burnet County. In most respects, Burnet County is less racially diverse than Texas; 72.6% of the population identifies as White (compared to 52.9% in Texas). However, the County is higher in Hispanic or Latino populations than the United States (23.0% in Burnet County as compared to 14.3% in the USA).
Employment Trends
The unemployment rate in Burnet County (3.7%) is lower than both Texas (5.4%) and US (5.5%). However, 57.2% of the population (16+) is not in the labor force, more than either the average in Texas or the US as a whole.
|
Subject |
Estimate |
Percent |
|
Population 16 years and over |
39,487 |
--- |
|
In labor force |
22,602 |
57.2% |
|
Employed |
21,749 |
55.1% |
|
Unemployed |
826 |
2.1% |
|
Not in labor force |
16,885 |
42.8% |
|
Unemployment rate |
--- |
3.7% |
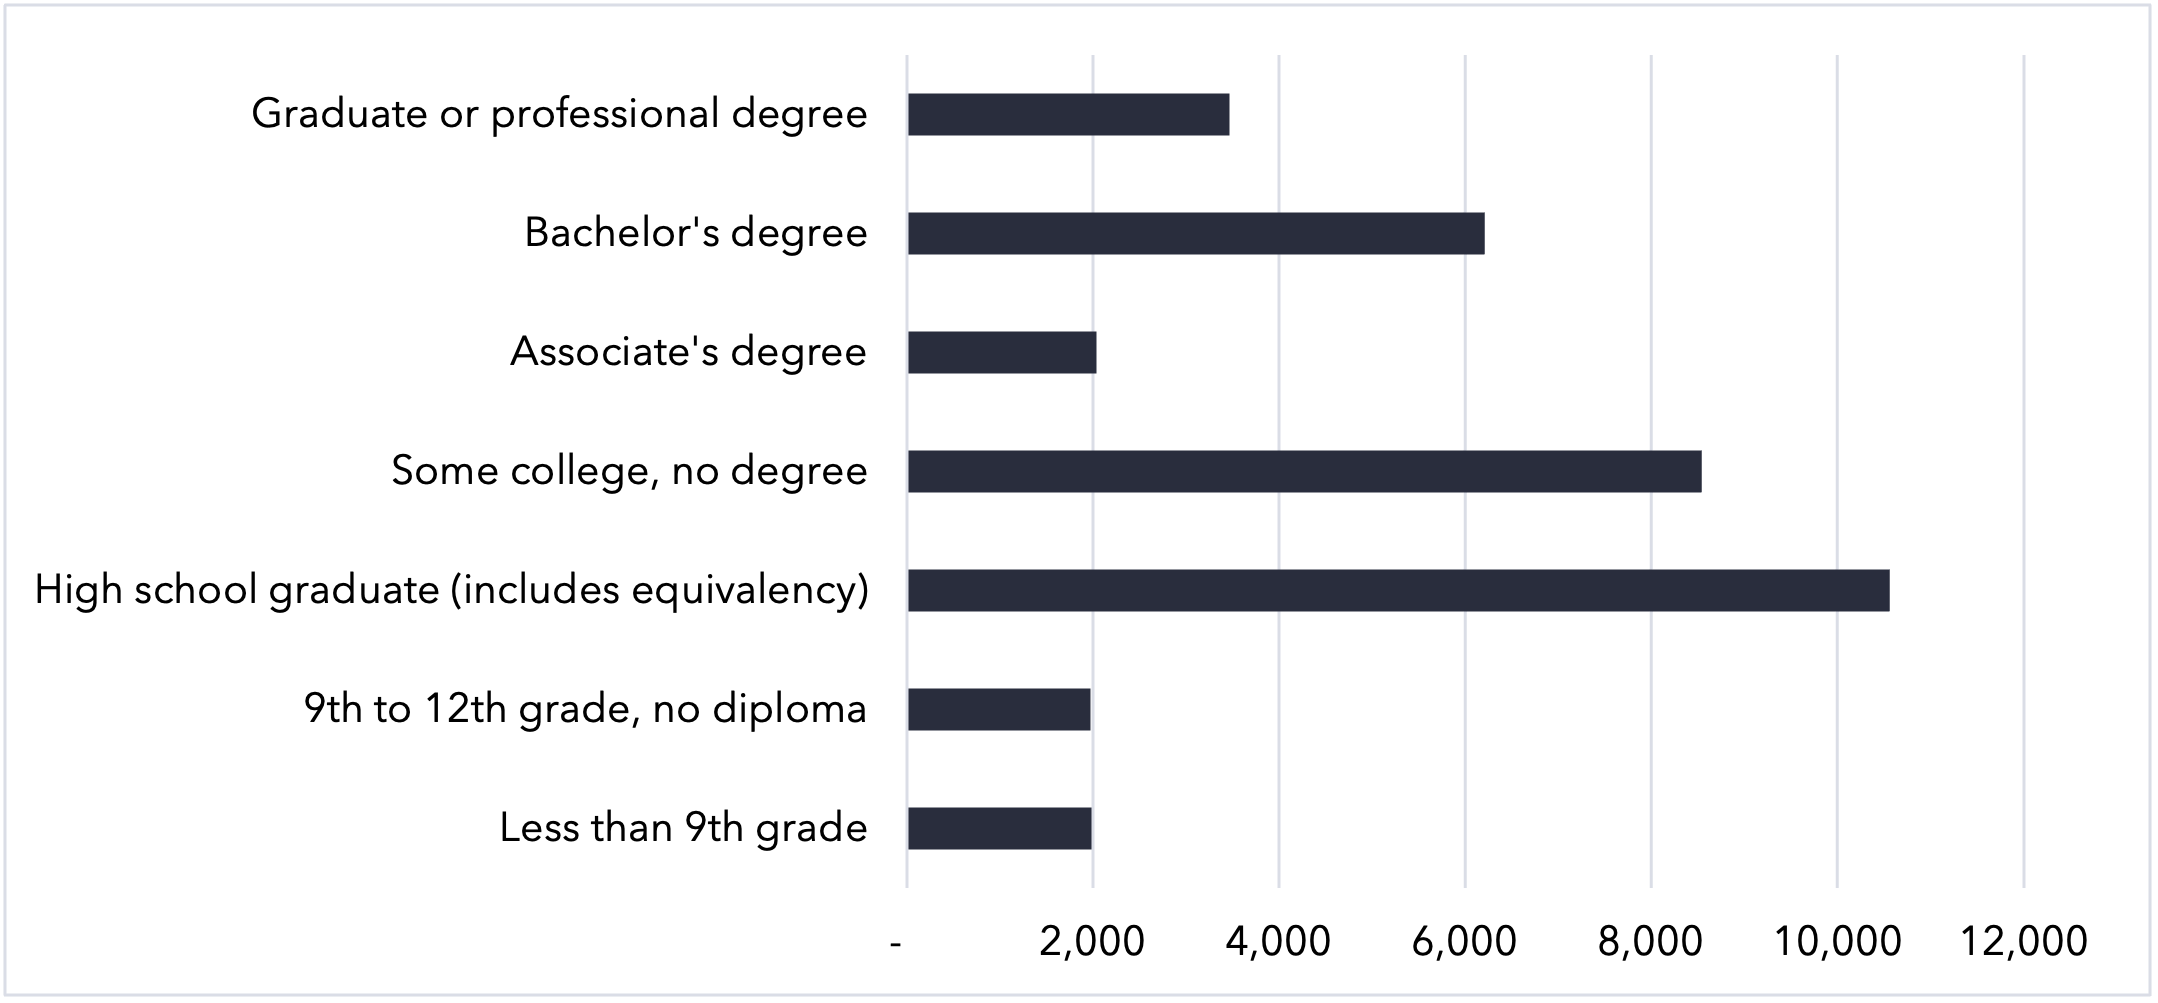
Educational Attainment
Of the population 25 years old and over, 88.6% have at least a high school degree. With 34% of people (25+) in the US holding at least a bachelor’s degree and 31% in Texas, Burnet County’s 27.8% is slightly lower.
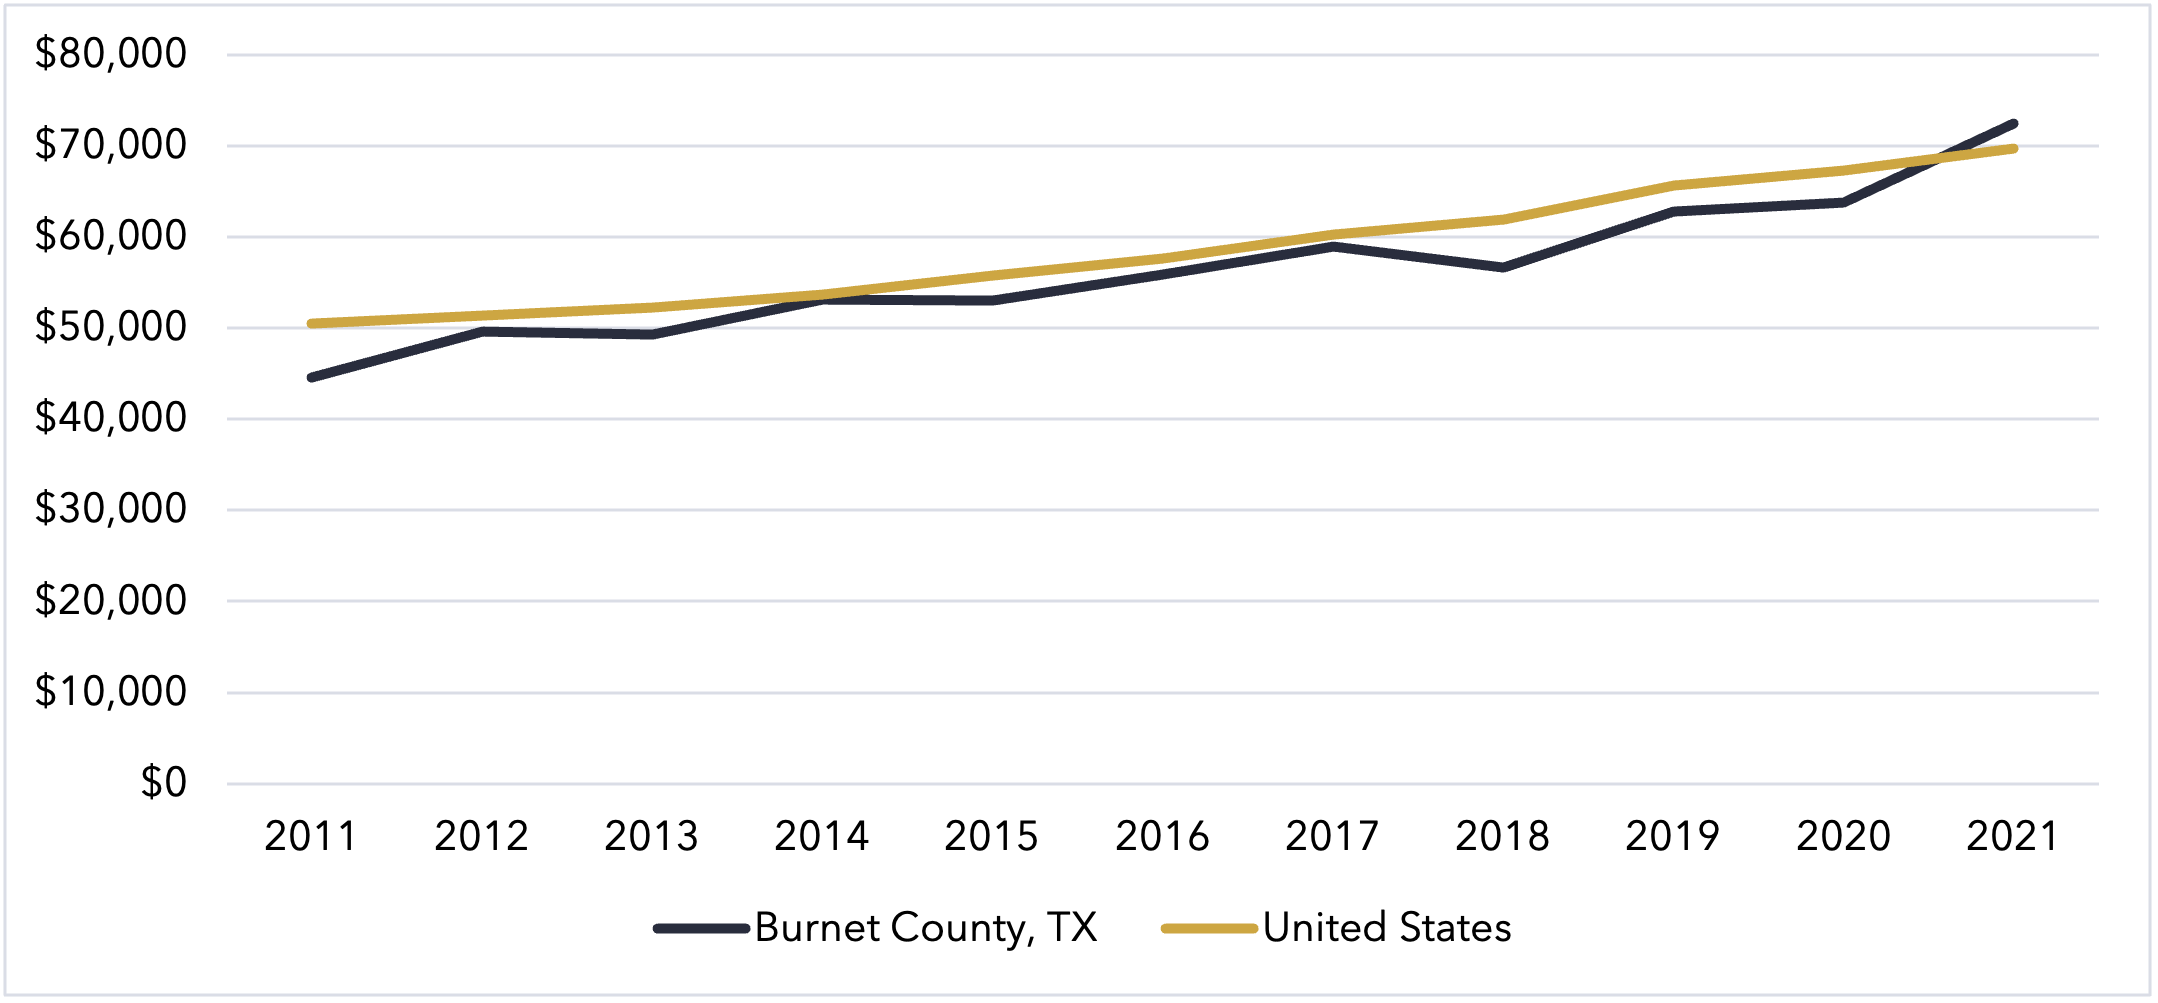
Wage Trends
The Median Household (MHI) in Burnet County in 2021 was $72,510, slightly higher than the US’s $69,717. However, Burnet County’s MHI in the past decade has largely been in line with US trends, surpassing the average in 2021.
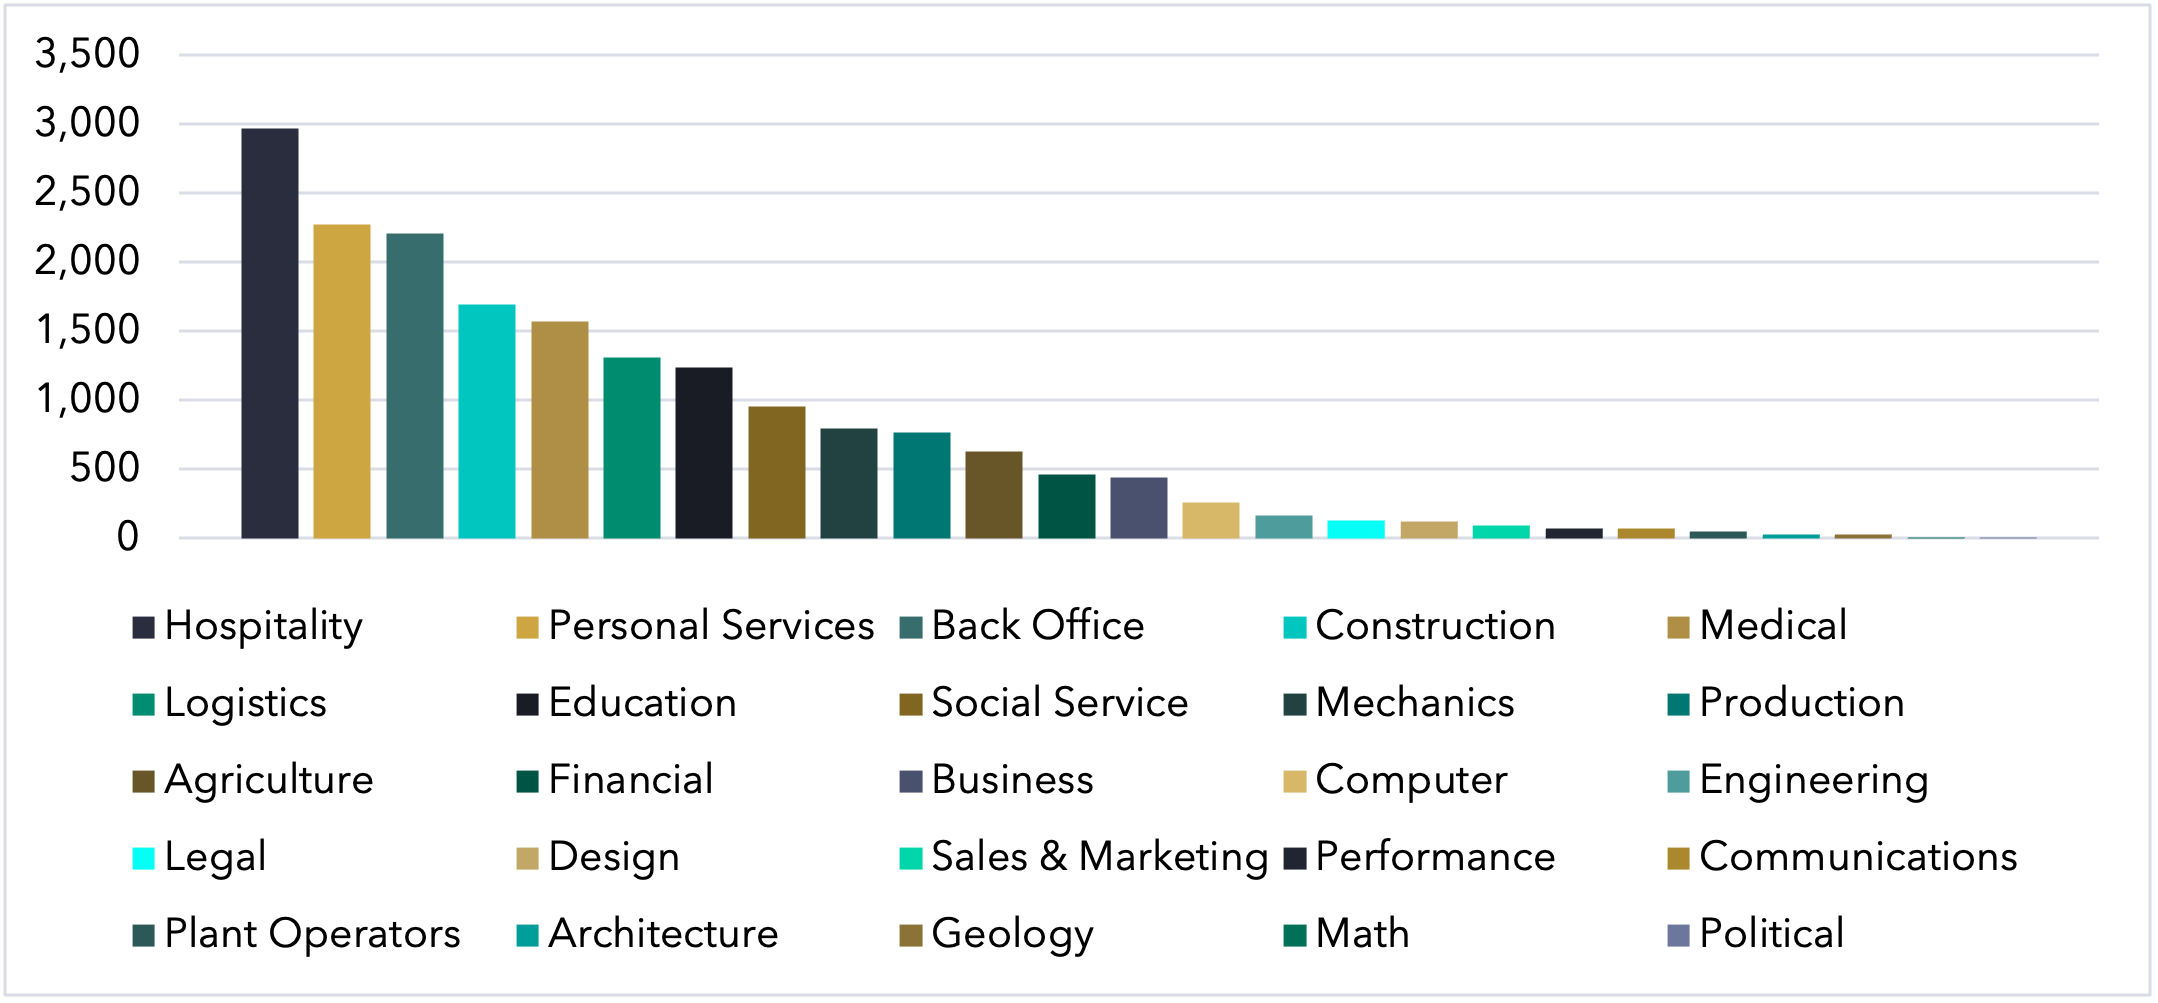
Industry and Occupation Snapshots
Total employment by occupation in Burnet County is 18,326. Trade, transportation, and utilities employ the most workers of any industry in Burnet County, followed by Government. Health Services & and Private Education, Leisure and Hospitality, and Construction are also in the top five industrial employers. The largest employment by occupation in Burnet County is in Hospitality.
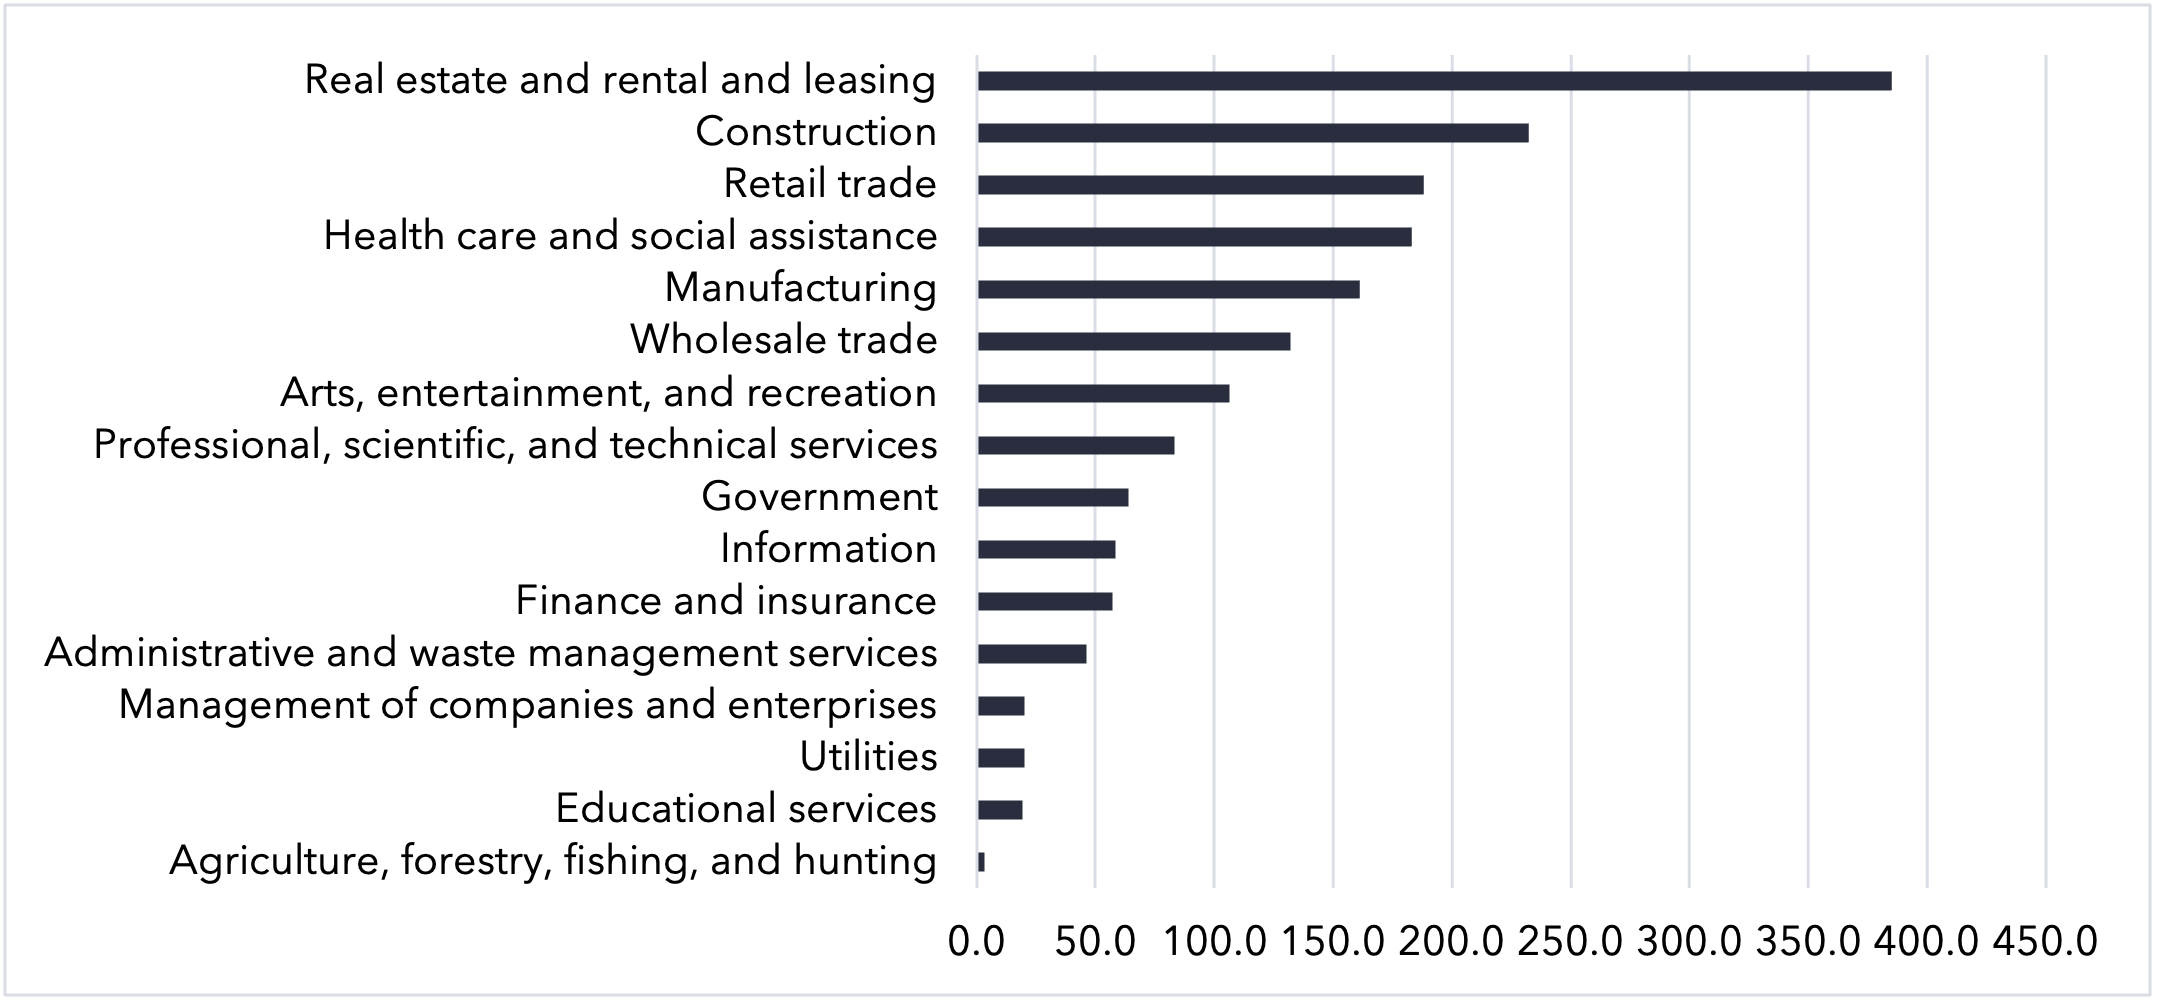
Gross Regional Product
Gross regional product (GRP) is the same as gross domestic product (GDP), but for areas smaller than the United States. GRP simply measures the monetary market value of all final goods and services produced in a region, in this case, Burnet County. In Burnet County, the industry that generates the most GRP is Real estate and rental and leasing, followed by Construction.