Over the last two years (2020 and 2021), the Rural Capital Area (RCA) has experienced population increases larger than any other point in the last decade. Now adding more than 40,000 new residents a year, the Covid-19 pandemic re-ignited a trend of people moving to the RCA that waned in the mid-to-late 2000s. The following analysis explores this trend in more detail, outlining how the components of the RCA’s population growth have changed over the last decade and which specific counties contributed the most to that growth.
The data analyzed here is from the US Census Population Estimate program and can be found on the RCA Headlight dashboard, Components of Population Growth. Recently updated with 2021 figures, the dashboard shows the different components that make up population change. First, there is natural change, which is simply a measure of the number of babies born minus the number of deaths. The other source of population change is people moving in or out of the area, or net migration. The Census breaks this into two measures by capturing domestic migration and international migration. Domestic migration includes anyone moving from elsewhere in the US and its territories into the RCA. International migration captures the total number of people moving from another country. Together, these components paint a picture of the changing demographic landscape.
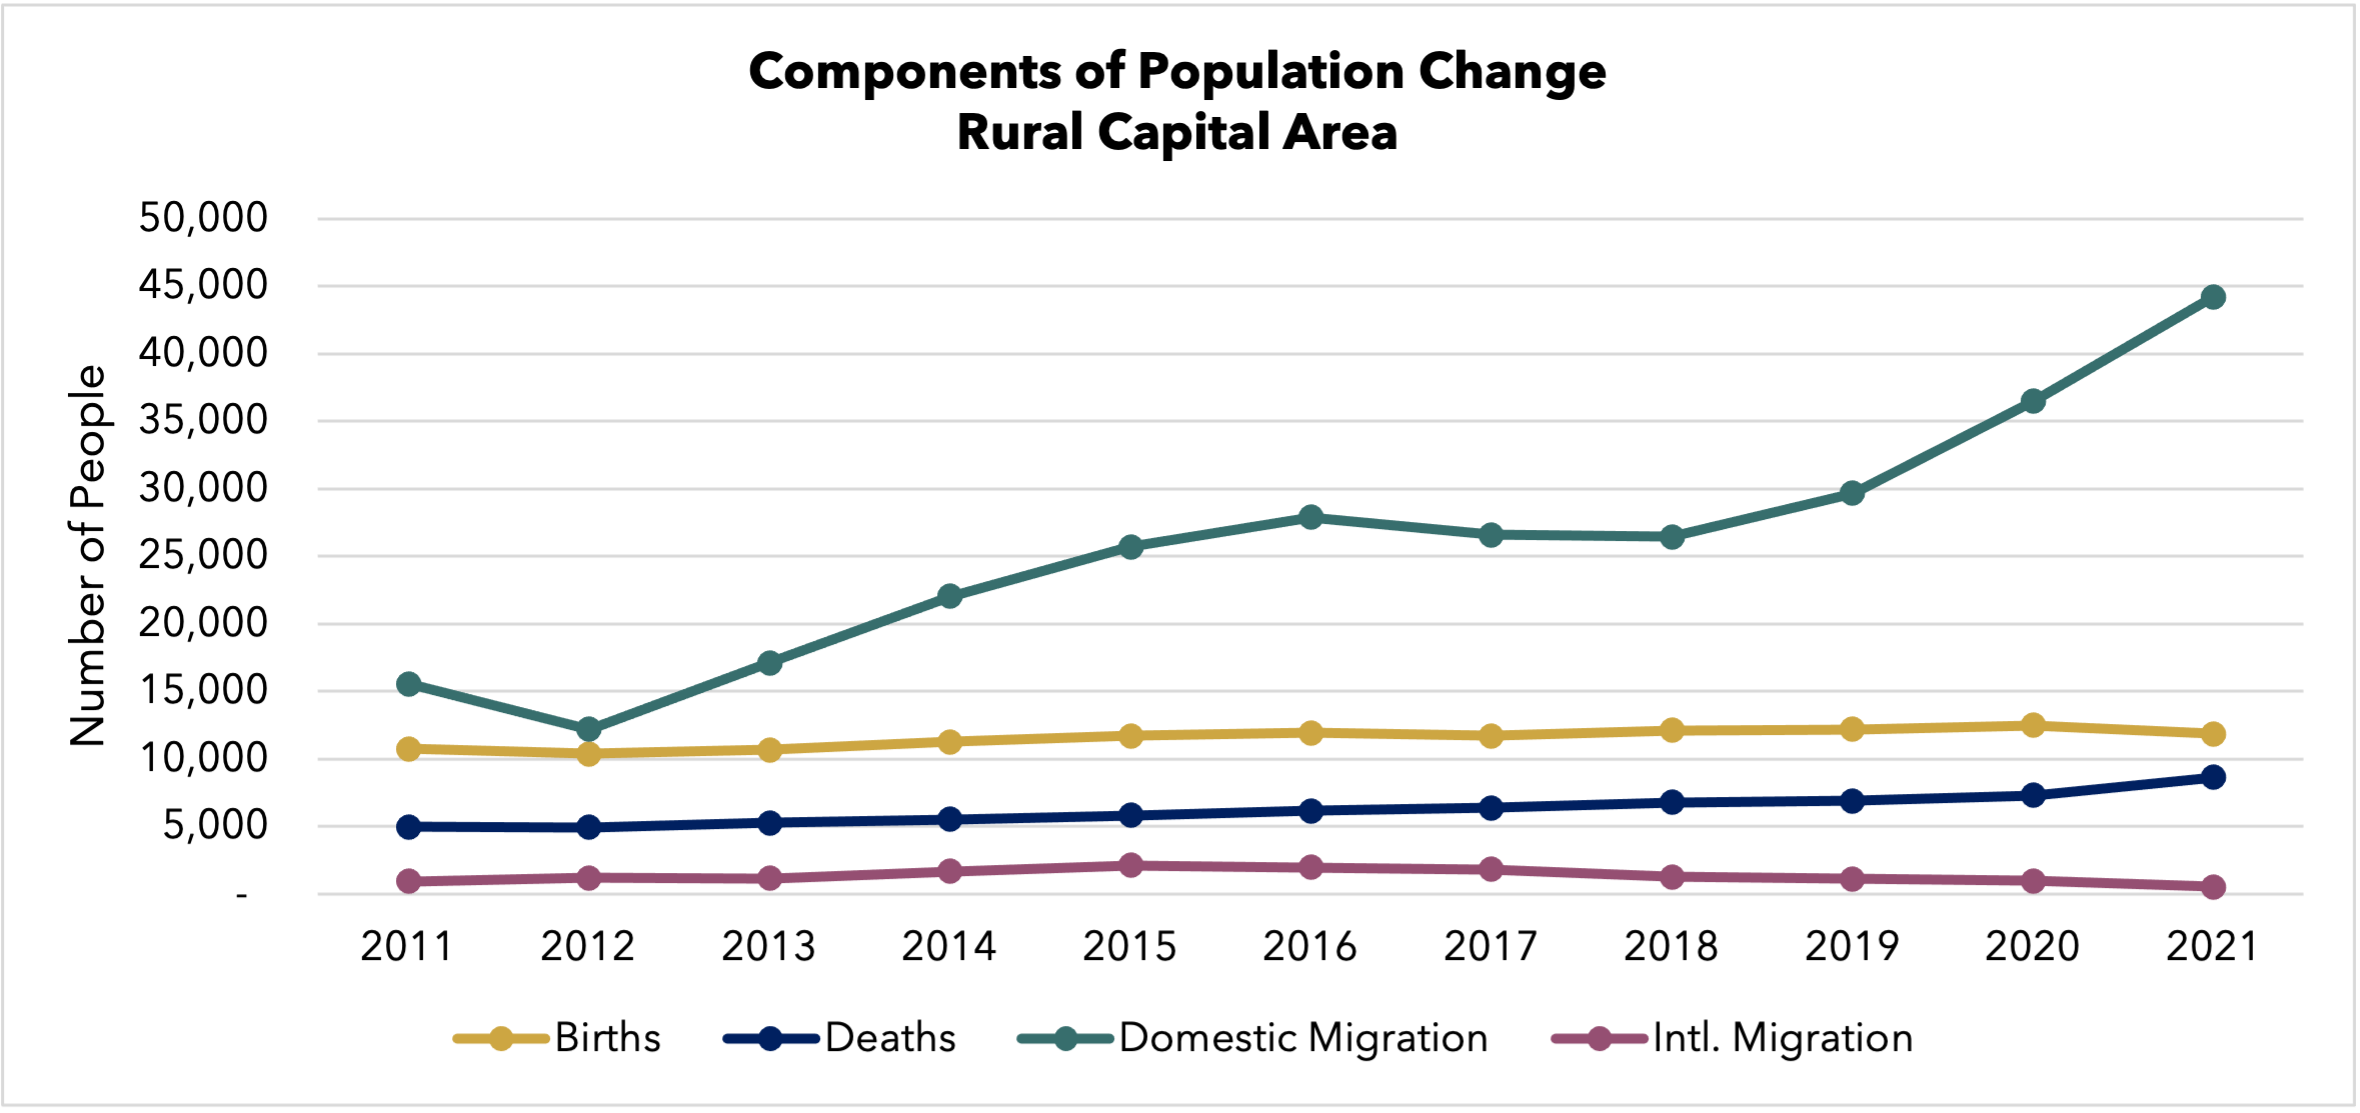
Overall, the RCA has added at least 20,000 new residents to its population every year since 2011. And every year, most of that change is driven more by domestic migration than by births. In 2011, 70 percent of population change was caused by new residents moving in from a domestic location and 26 percent of the population change was due to natural increase (with the remainder due to international migration). In 2021, this split was even more drastic, with 92 percent of total population change coming from domestic migration and only seven percent of growth due to natural increase.
The chart below breaks down the components of RCA population growth in more detail.

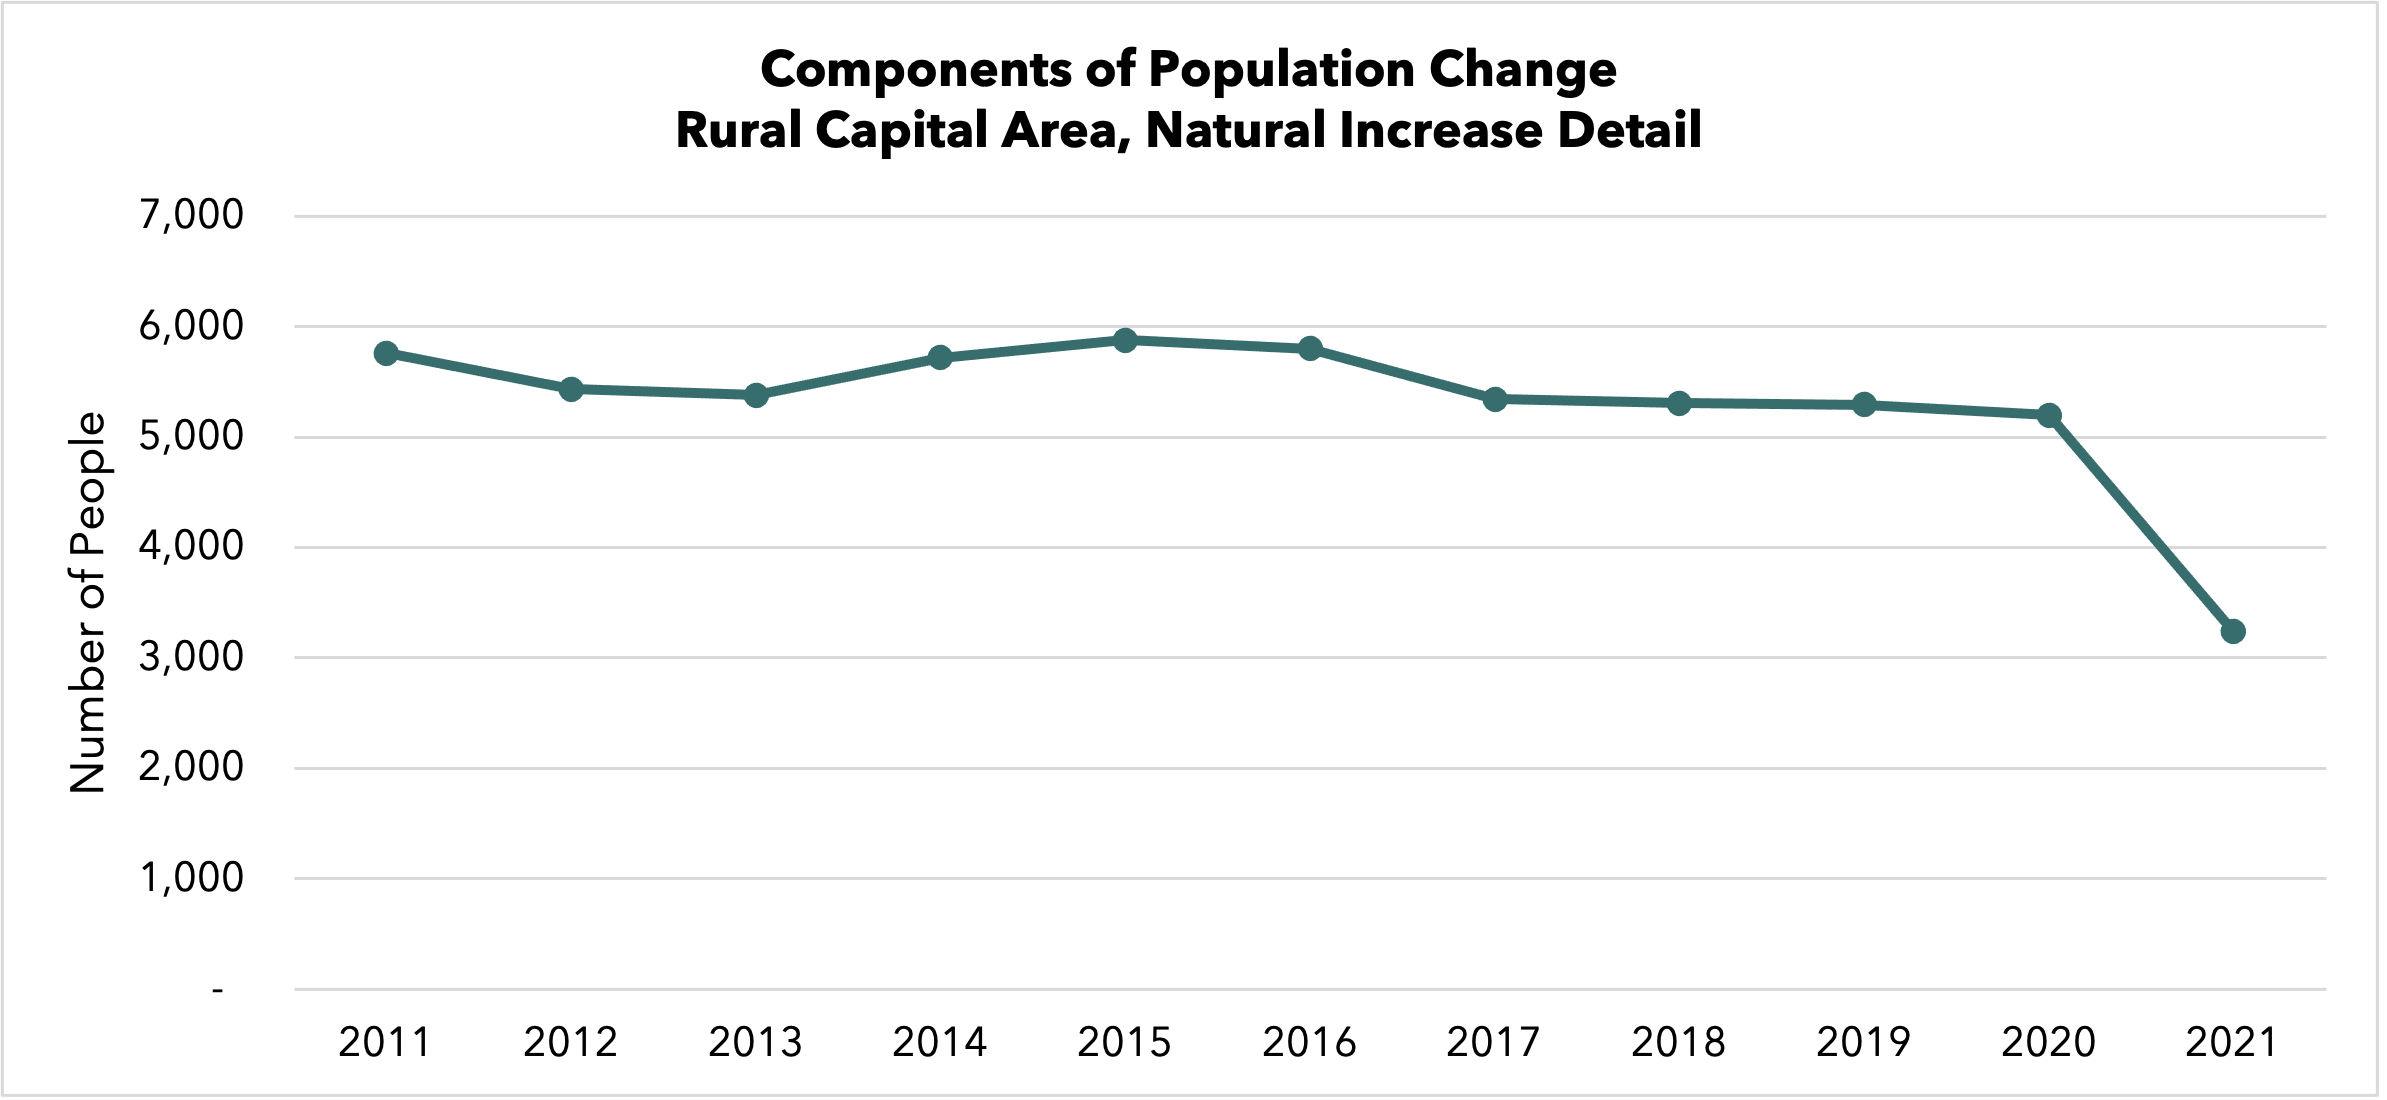
Note the closing gap between the number of births and deaths in the chart above. Births shrank while the number of deaths rose in 2021. While natural change remained steady in the RCA from 2011 to 2020, ranging somewhere between 5,000 and 6,000, it took a sharp dip in 2021 to a net change of only 3,200. See the chart below. This could be due to a combination of factors including individuals choosing to wait to start families during the height of the Covid-19 pandemic. More broadly, this closing gap between births and deaths has been expected in the United States for some time, as the Baby Boomer generation ages and current birth rates shrink. In fact, 2021 was the first year since 1937 that the total United States population added fewer than one million people.

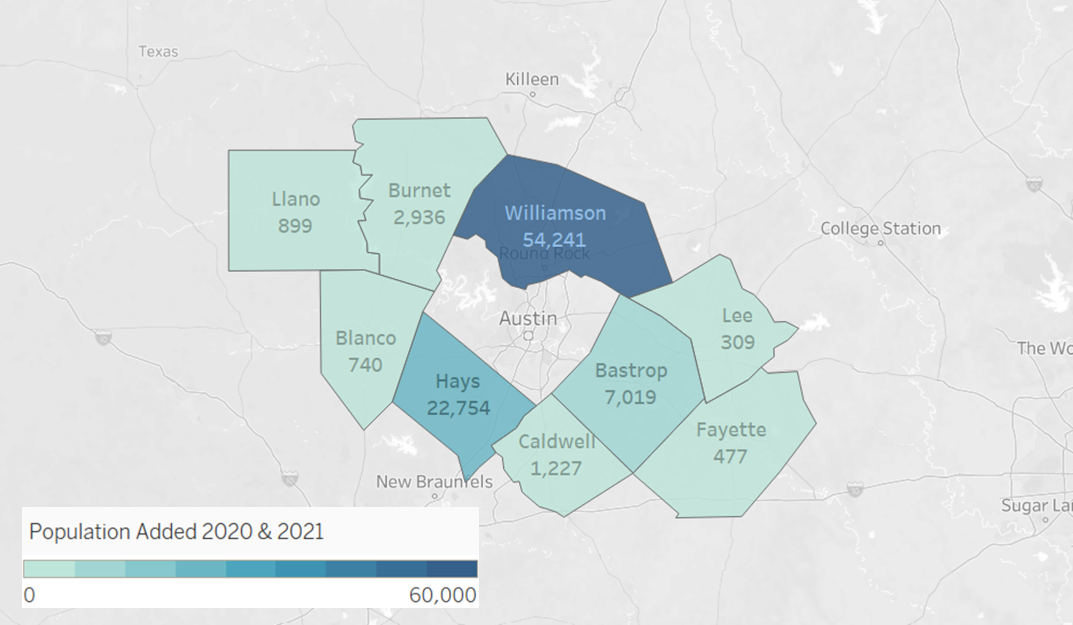
With this broader context in mind, moving forward domestic migration and international migration will continue to be the main, if not only, source of population growth, for regions. More broadly speaking, certain metros are proving major winners in this equation, while others are greatly declining. Texas is a state with an upward net migration trajectory, hosting four of the nation’s top ten metros for population increase. At the county level, Williamson County gained the most new residents (either from natural increase or movers) in the last two years, followed by Hays County. The map below shows the total population change in both 2020 and 2021 for each county.

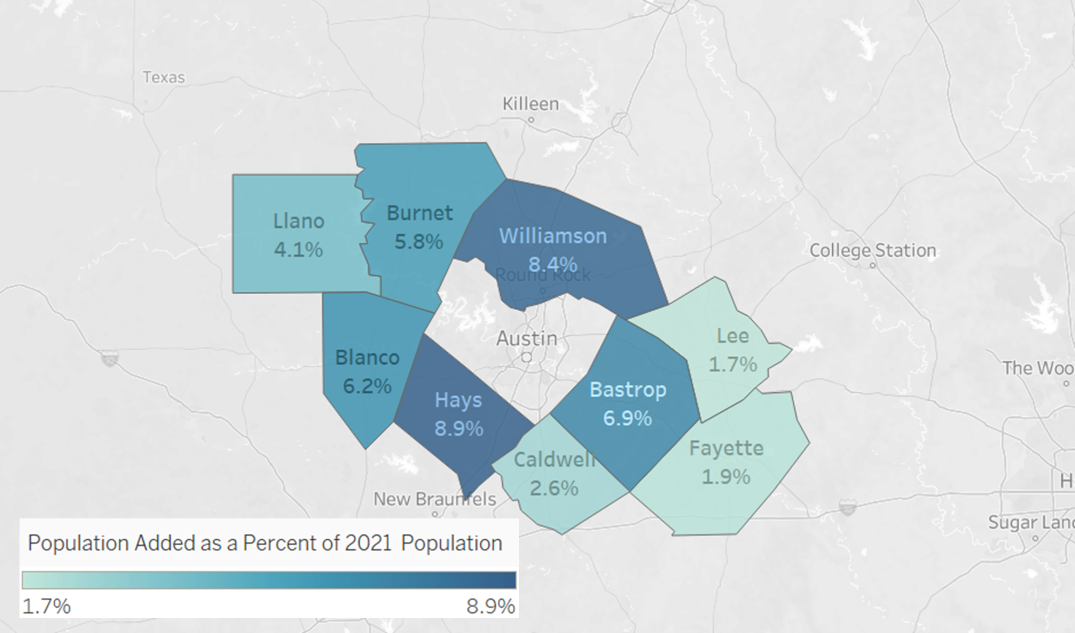
While Williamson County added the most new people in absolute numbers, Hays County added the most new residents relative to population size. The map below shows the number of new residents added in each county in 2020 and 2021 as a percentage of that county’s total population. For example, roughly nine percent of Hays County’s total population either moved to or was born in the county in the last two years. Analyzing new residents as a percent of the total population accounts for counties that may be smaller overall but still added a relatively large number of new residents. The map below shows that counties bordering Austin added the most new residents (the darkest on the map) while counties to the northwest also captured a large percentage of pandemic movers as individuals left major urban centers. RCA counties to the southeast did not see this same influx of new residents (the lightest colors on the map).

Overall, the RCA experienced a sharp increase in domestic migration in 2020 and 2021 as the pandemic accelerated a trend that was already in the works. More than 28 percent of all people who moved to the region in the last 10 years, did so in just 2020 or 2021. Put another way, if you pick out four random people who live in the RCA, chances are at least one of them will have moved to the region in only the last two years. As far as specific counties go, many of these new residents are moving into Hays and Williamson County, potentially leaving Austin proper in search of more affordable housing. Large contingents are also moving to Bastrop, Blanco, and Burnet County which also share a border with Travis County.